


2020 User Survey Results
Methodology
NERSC conducts an annual user survey to collect feedback on the quality of its services and computational resources. The user survey was first conducted in 1998 and underwent significant revisions in 1999 and 2018. Since 2019 we have outsourced the survey process to the National Business Research Institute (NBRI), a global research and consulting organization with expertise in customer surveys.
Outsourcing the annual survey has reaped several benefits:
- Advice on survey design adjustments to follow best practices.
- Expert analysis of the survey results, including:
- A “benchmark analysis” comparing survey results across organizations in the same industry (as classified by the North American Industry Classification System, NAICS);
- Root-cause analysis identifying which survey topics had the most impact on the overall satisfaction scores;
- Text analytics identifying common positive and negative themes in free-form comment-type questions.
- Increased user participation. In past years before using NBRI, NERSC needed to send several email reminders, including targeting users, to reach our target of responses from 10% of the user community. For the 2020 survey, with little action from NERSC, we received 1,010 survey responses, representing over 12% of the user population and over 51% of the compute hours used (Figure 1).
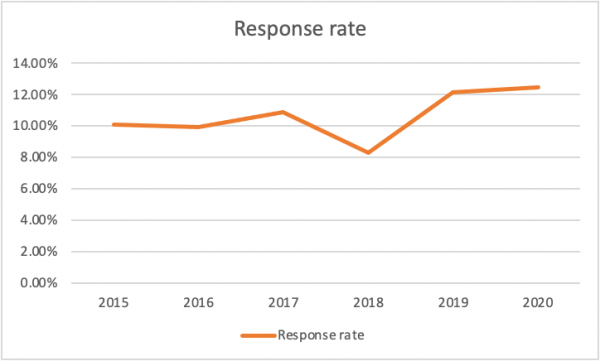
Figure 1: Outsourcing the user survey to NBRI and making it shorter starting in 2018 has increased the response rate on the annual user survey.
NERSC aims to receive survey responses from 10% of active users and representing 50% of the NERSC Hour usage, to ensure that users who most closely interact with NERSC systems and services are sufficiently represented and that the survey responses reflect the impact of NERSC operations.
The 2020 User Survey ran from November 19, 2020 to January 6, 2021. The survey was sent to 8,118 active users and received responses from 1,010 of them, representing 12.4% of active users and 51.2% of the total charged hours in 2020. NBRI found that results of the survey reach a 99.9% confidence level with a 4.6% sampling error. The increased number of users to whom the survey was sent was a combination of the increasing number of NERSC users, the adoption of a slightly broader, more consistent definition of a user, and applying that within Iris (NERSC’s new identity and access management system, adopted in December, 2019 to replace the NIM system) to generate the user list for the first time.
| Survey sent to 8,118 active users | 2019 Target | 2019 Actual | 2020 Target | 2020 Actual |
| Number of users surveyed | 6,792 | 6,792 | 8,118 | 8,118 |
| Total # of responses | 679 | 824 | 812 | 1,010 |
| % of all active users responding | 10% | 12.1% | 10% | 12.4% |
| % of NERSC-Hours represented by survey respondents | 50% | 51.5% | 50% | 51.2% |
Table 1. 2020 NERSC user survey response rate.
Survey Design and Methods
Since 2019, the survey has used a six-point scale from “very dissatisfied” to “very satisfied.” NBRI advised that the six-point scale is a survey best practice. By disallowing a completely neutral response, a better understanding of user sentiment can be obtained.
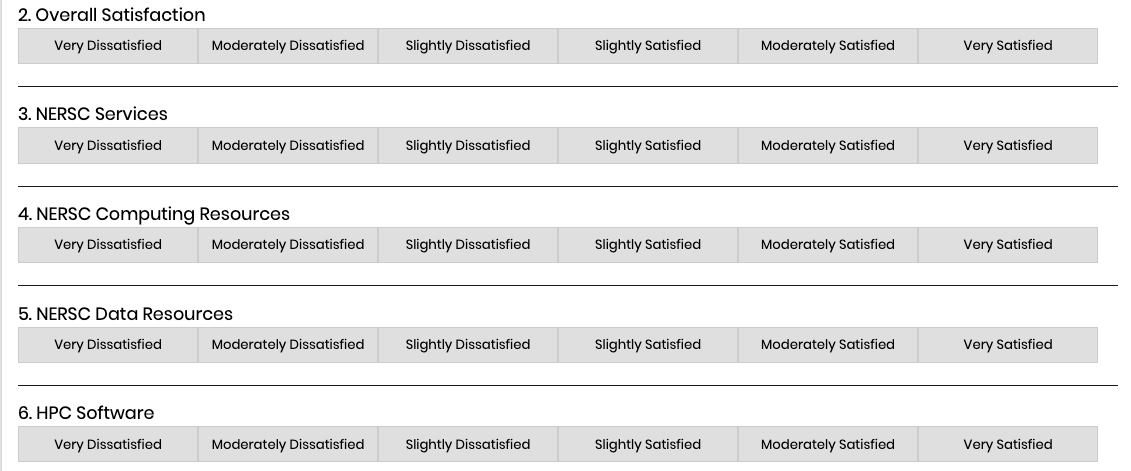
Figure 2. A sample of the 2020 survey. Users select their sentiment on each item by clicking the appropriate phrase.
Results
The overall satisfaction scores for 2019 are shown in Table 2.
| Survey Area | 2019 Target | 2019 Actual | 2020 Target | 2020 Actual | Standard Deviation | Median | Inter-quartile range | % responses exceeding target |
| Overall Satisfaction | 4.5 | 5.29 | 4.5 | 5.28 | 1.14 | 6 | 1 | 87.7% |
| Services Overall | 4.5 | 5.45 | 4.5 | 5.42 | 1.09 | 6 | 1 | 86.9% |
| Avg. of user support ratings | 4.5 | 5.30 | 4.5 | 5.35 | -- | -- | -- | -- |
Table 2. Overall satisfaction ratings.
The overall satisfaction scores were well above target and in line with 2019 scores with minor variations. None of these changes in the scores were statistically significant. The average satisfaction scores in each category remained well above the minimum satisfaction target, as shown in Figure 4.
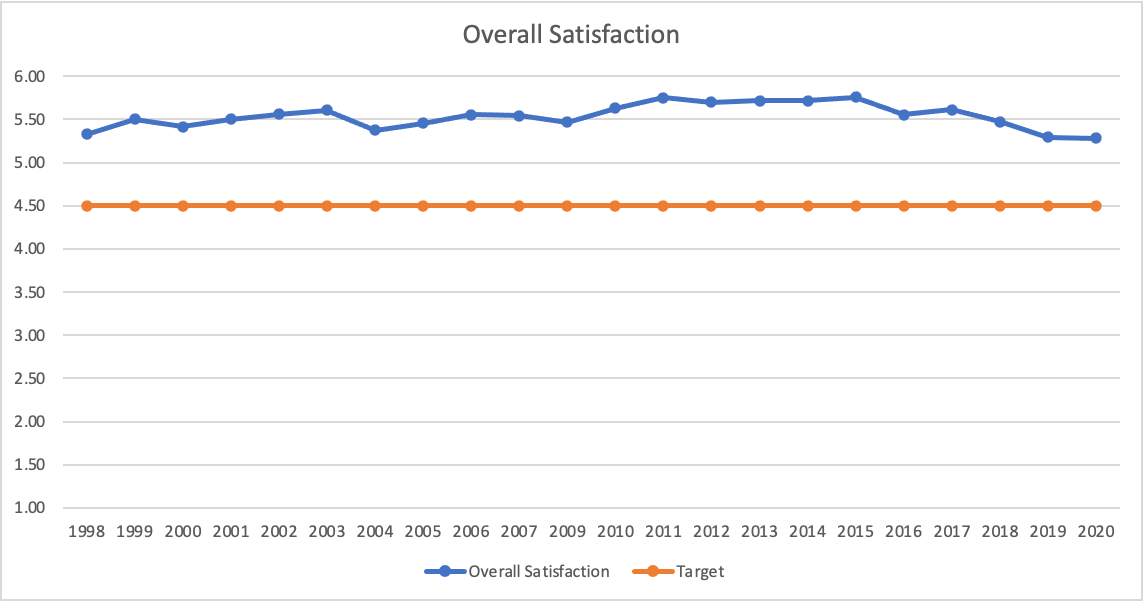
Figure 3. Overall satisfaction metric over time since the survey was first implemented. Scores before 2019 are adjusted from the previous 7-point scale to the current 6-point scale. The algorithm used to adjust from the 7-point-scale to the 6-point scale was described in the Operational Assessment report for 2019.
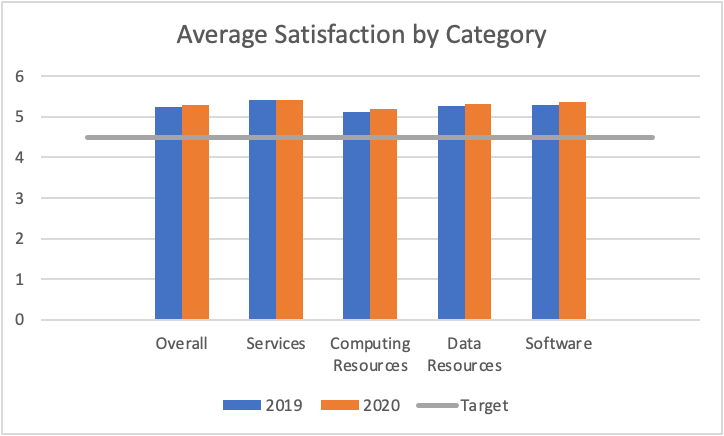
Figure 4. Average satisfaction scores for each category.
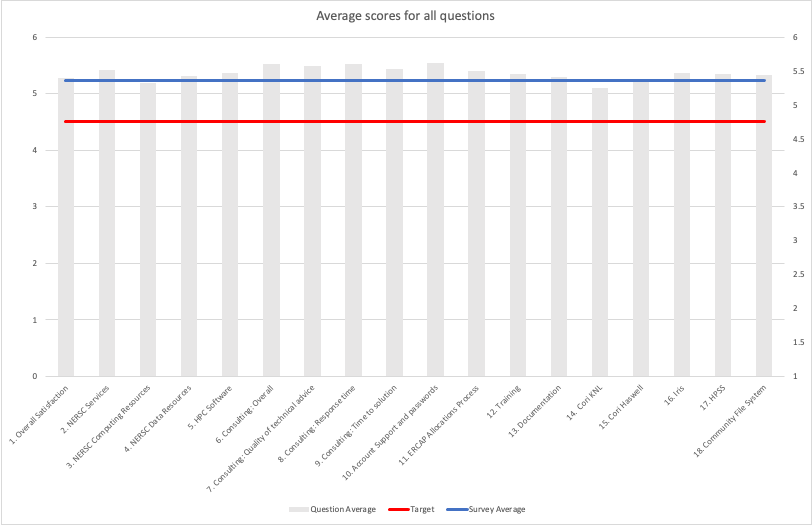
Figure 5. Average scores for all quantitative survey questions were high and above target.
Factors Affecting Satisfaction
The survey analysis from NBRI identified a number of high-impact themes across the quantitative and qualitative survey questions – that is, survey questions and user comments which had high impact on the overall satisfaction rating. The highest impact categories for NERSC user satisfaction, as identified by NBRI, are Services and Computing Resources, with some specific high-impact themes being:
- Technical Support: The ability of NERSC staff to quickly and effectively resolve technical issues had a positive impact on overall satisfaction, according to NBRI’s statistical analysis.
- Response Time: Most user questions are addressed promptly, contributing to high satisfaction scores.
- Computational Resources: While users always want more resources, NERSC users are positive about the quality and diversity of resources NERSC provides. Some users did report finding downtimes due to scheduled maintenance or unscheduled events too disruptive.
- Documentation: NERSC's documentation is considered high quality, however, users would like to see improvements in the transfer of knowledge from the help-tickets system, where NERSC staff provide solutions directly to individual users, into the documentation where those solutions could be seen and re-used by the wider user community. Documentation is a particularly high-impact theme both for satisfaction (with NERSC documentation quality) and dissatisfaction (the desire for more documentation).
- Allocations: Users were pleased by the ease of the ERCAP process and the quality of documentation around it. They would of course prefer to receive larger allocations.
- Queue Time: Some users found queue times reasonable, others found them to be too long, increasing, or not satisfactorily distributed across different types of usage.
Understanding and Addressing Dissatisfaction in Users
We aim each year to identify and address sources of dissatisfaction. The primary sources of dissatisfaction in 2019 were queue wait time and system downtimes. In 2020 we made several changes to improve queue wait time:
- In early 2020 the charge factors on Cori-KNL and Cori-Haswell were adjusted to better reflect the real-world performance realized by many users. This resulted in a lower charge on KNL relative to Haswell and helped balance demand among the two types of nodes. As a result, queue wait times were shortened on Haswell and remained reasonable on KNL.
- A combination of improvements to Slurm and adjustments to queue policy have led to very high utilization throughout 2020, which had the effect of making more hours available to users, which helps reduce waits in the queues, as discussed in the following points:
- The flex queue introduced in 2019 allows users to specify a range of acceptable run times, which allows the scheduler to start their jobs earlier when a “gap” of an acceptable length in the schedule becomes available. This enables these jobs to run in schedule gaps that would otherwise be empty, increasing overall machine utilization and decreasing wait time for other jobs.
These efforts appear to have had a positive impact: while queue time was still frequently cited as something NERSC could improve, many user comments about queue time were positive, and queue wait times were a much less prominent source of dissatisfaction in 2020.
The key themes for user dissatisfaction in 2020 were:
- Downtimes: The frequency of downtimes for scheduled system maintenance or infrastructure upgrades, and unexpected incidents impacted users.
- Documentation: Users expressed a desire for expanded and improved documentation, especially for novice users.
Reducing Downtime
Cori Scheduled Availability in 2020 was 97.38%, and overall availability was 92.60%, in line with 2019 figures, and there were fewer outages in 2020 than 2019. However, user comments indicated a perception that downtime was noticeably worse in 2020. We think the following factors contributed to this perception:
During 2020 the entirety of NERSC underwent three scheduled, multi-day outages while the NERSC facility electrical power was upgraded in preparation for the installation of NERSC9/Perlmutter. A fourth scheduled multi-day outage on Cori was for a major upgrade to Cori's Lustre file system; in addition, an unscheduled, exceptional multi-day outage occurred late in the year when individually minor bugs in each of Lustre, Linux, and a user's workflow coincided to crash Cori's Lustre file system.
During 2020 Cori was NERSC's only computational system, so users had no second system to use during monthly scheduled outages for system maintenance.
Collectively, the exceptional outages and the scheduled maintenance outages without a second available system contributed to the perception of more downtime. We expect this to be alleviated in 2021 and 2022 due to the following considerations:
- The power upgrades are complete, and we don't expect to require further major, disruptive works for several years.
- Perlmutter will be installed in 2021, so in 2022 users will have access to both Cori and Perlmutter, reducing the impact of monthly scheduled maintenance. Furthermore, we expect to be able to perform much routine maintenance on Perlmutter without requiring a system-wide outage.
- The Cori file system crash in 2020 was an unusual event, and during its progress, with help from HPE, we were able to identify and fix the root causes (see Section 5.3 for a more detailed discussion). We also improved facility resilience by loosening the dependencies between NERSC systems and services, which will help future unexpected failures in one component from impacting other NERSC systems and services.
Improving Documentation
In recent years NERSC has updated its processes to improve the manageability of our user-facing documentation, moving from the Silverstripe CMS to the MkDocs framework. The documentation itself is written in Markdown (a simple text markup language) and hosted in a publicly accessible GitLab repository; the static site is automatically regenerated upon merge-to-master, which requires approval from a NERSC staff member. NERSC encourages users to submit merge requests when they have identified deficiencies in the documentation; a handful of changes last year were submitted by users.
With more than 8,000 users, NERSC views high-quality and comprehensive user-facing documentation as vital for user support at scale. Over the years, a number of different websites/portals have been created, each with valuable information for users or with the ability to provide an important service or capability (e.g., my.nersc.gov, help.nersc.gov, docs.nersc.gov, iris.nersc.gov,www.nersc.gov). Users have told us that they find this diversity somewhat confusing and difficult to navigate, so NERSC has engaged with UI experts at Berkeley Lab to generate suggestions for making things easier for users.
A specific limitation in our documentation that several survey respondents cited is in help for inexperienced users. In addition to developing more documentation targeted at new users, we have launched a series of “NERSC-101” sessions as part of our appointment-based office hours.
User Comments
The three free-form questions in the user survey gave users a chance to comment on issues important to them. Users are asked, “What can NERSC do to serve you better?”, “What does NERSC do well?” and “Is there any other issue on which you would like to comment?”
What does NERSC do well?
We received 498 responses to the question “What does NERSC do well?” There were a few broad categories that users called out the most:
- Consulting, account support, and training
- Providing high-quality, usable resources
- Documentation
- Software
- Communication with users
Sample user comments
- Excellent user support, expert technical advice, very helpful and dedicated HPC team.
- Great computing resources. Codes optimized for the platforms. Decent waiting time for jobs. Ample storage. Flexible and secure connection and data transfer methods. Streamlined online documentation. Training offered on key software. Overall, NERSC is an indispensable resource for my research, and the NERSC team has done a great job.
- Quality and extent of documentation and trainings is superb
- Very complete and up-to-date software stack, which saves development time.
- The communication to users is excellent - the best I have seen from any HPC center.
What can NERSC do to serve you better?
This question elicited 404 responses. The most common were related to:
- The amount of time Cori was unavailable due to maintenance
- Queue wait times
- Better policing of (other) users over-using the shared login nodes
- Improve documentation.
Sample user comments
- Queue wait times are still a problem. Other than that, the NERSC should serve as a model for computing centers worldwide.
- It would be helpful if NERSC were unavailable for maintenance less often.
- During monthly maintenance, it would be extremely helpful to keep at least some login nodes available so that users can still do code development work.
- Better documentation and tools for getting started.
- The documentation of Iris is poor but appears to be improving.
- The documentation, while very good, was at times a little too advanced for a beginner.
Is there any other issue on which you would like to comment?
Comments in this section largely reflected those in the previous two, along with requests or thanks for specific resources and software NERSC provided.