


2017 User Survey Results
Methodology
NERSC conducts a yearly user survey to collect feedback on the quality of our services and computational resources. The user survey was first conducted in 1998; significant revisions occurred in 1999, and the format has remained essentially stable since then, with only hardware-related specifics changing each year. In 2017 two new non-hardware categories were added: NERSC communications and NERSC support of Python.
For the 2017 survey NERSC changed the underlying collection technology used on the web. The types of questions and scale were unchanged from previous years and a strong effort was made to keep the survey as similar as possible except for a few individual questions. Nevertheless the interface did have a somewhat different “look and feel.” As discussed below, the responses to the 2017 survey showed an unusual volatility compared to previous years. The effect of this seemingly small change in presentation is unknown. We will be interested to see what happens in 2018, the second year we’ll use the new system.
The 2017 User Survey ran from January 2, 2018 to February 20, 2018. NERSC aims to receive survey responses from at least 10% of active users and representing at least 50% of the NERSC-hour usage, to ensure that our largest projects are sufficiently represented and that the survey responses reflect the impact of NERSC operations. As shown in Figure 1, the 2017 user survey had responses from 10.9% of active users representing 54% of the NERSC-hours used.
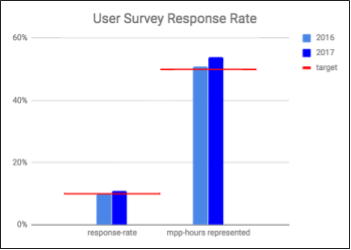
Figure 1. User survey response rate.
The survey uses a seven-point rating scale, where “1” is “very dissatisfied” and “7” indicates “very satisfied.” For each question the average score and standard deviation are computed. For questions that were on the previous year’s survey, the change in score is considered significant if it passes the standard t-test criterion at the 95%confidence level.
Results
Historically the average score for overall satisfaction has been in the "very satisfied" range, and this was true for 2017. Figure 2 shows that in some categories the satisfaction metrics improved slightly on 2016, while in others they were slightly worse. The overall satisfaction score was 6.38, which is not a statistically significant change from 2016 (Table 1). Our target is 5.25, which Figure 3 shows we have consistently exceeded.
|
Metric |
2016 Target |
2016 Actual |
2017 Target |
2017 Actual |
Significant Change |
|
Overall Satisfaction |
5.25 |
6.31 |
5.25 |
6.38 |
No |
|
Services |
5.25 |
6.55 |
5.25 |
6.42 |
-0.13 |
|
Computing Resources |
5.25 |
6.07 |
5.25 |
6.30 |
+0.23 |
|
Data Resources |
5.25 |
6.19 |
5.25 |
6.36 |
+0.17 |
|
Software |
5.25 |
6.34 |
5.25 |
6.23 |
-0.11 |
Table 1. Overall satisfaction ratings.
The addition of the Cori KNL nodes were reflected in the improvement in the score for overall Computing Resources. A number of users took advantage of the Cori Burst Buffer, which became more user friendly in 2017 and may have helped the overall Data Resources ratings. A higher proportion of tickets were answered by the Data and Analytics Services group, which is a sign of the ever-increasing interest in data resources.
In the Services area, users were presented with a new and unfamiliar ERCAP allocations request process that drew low scores. We attribute the decrease in consulting scores to the fact that many users were introduced to the novel, low-power, manycore Cori KNL system, which was challenging for novice users. For example, one user did not consider the decreased memory per core and became frustrated when they ran their code on the same number of cores as on Edison but ran out of memory. In the area of software, users were very pleased by new data software, but rated the overall programming environment software significantly lower than in 2016, which may have led to the overall Software score decreasing.
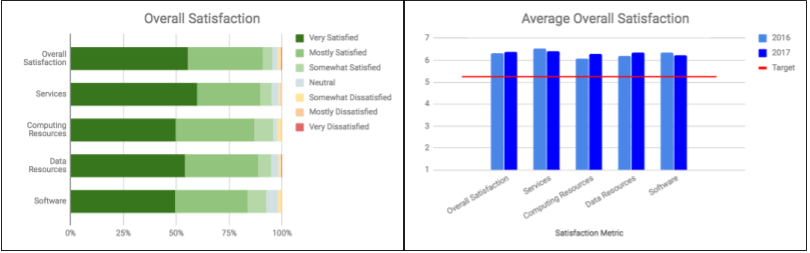
Figure 2. User survey overall satisfaction metrics.
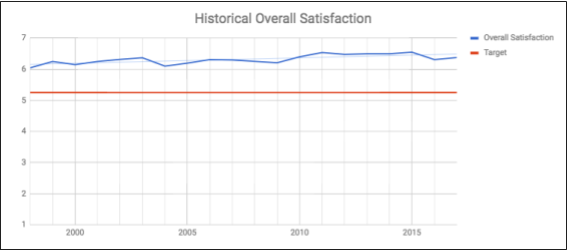
Figure 3. Overall satisfaction metric over time, since the survey was started.
The average user satisfaction scores for individual aspects of NERSC user service were much more varied, but consistently above target. The number of survey questions seeing a significant change in satisfaction was unusually high, which may be related to the change in collection technology. The 2017 satisfaction scores tended more towards neutral than in previous years: areas which scored lowest in 2016 saw significant increases in satisfaction scores while areas which scored highest in 2016 saw significant decreases.
Areas of Lowest Satisfaction
The areas of lowest satisfaction in 2017 were batch wait times for NERSC compute resources, purge policies on the scratch filesystems and quota on the /project filesystems.
One area fell marginally below target: "(Cori) Haswell batch wait time", with an average score of 5.21. This mostly reflects the large demand for NERSC resources. Conversely, satisfaction with Edison batch wait time, while still relatively low, improved significantly over 2016 scores. This reflects the changing demand as work shifted from Edison to Cori, as can be seen in the Figure 4 plots of queued work on each system.
In 2017, NERSC prepared and released "Storage 2020", a report outlining a roadmap and vision for addressing the data storage challenges the science community is expected to face over the next decade and beyond. NERSC is currently evaluating options for its next "Community Storage" tier in this roadmap, which is expected to alleviate the demand on the /project filesystem. During this transition, however, the size of /project is being kept static. As users generate more data, the /project space constraints increase the data management effort required by users.
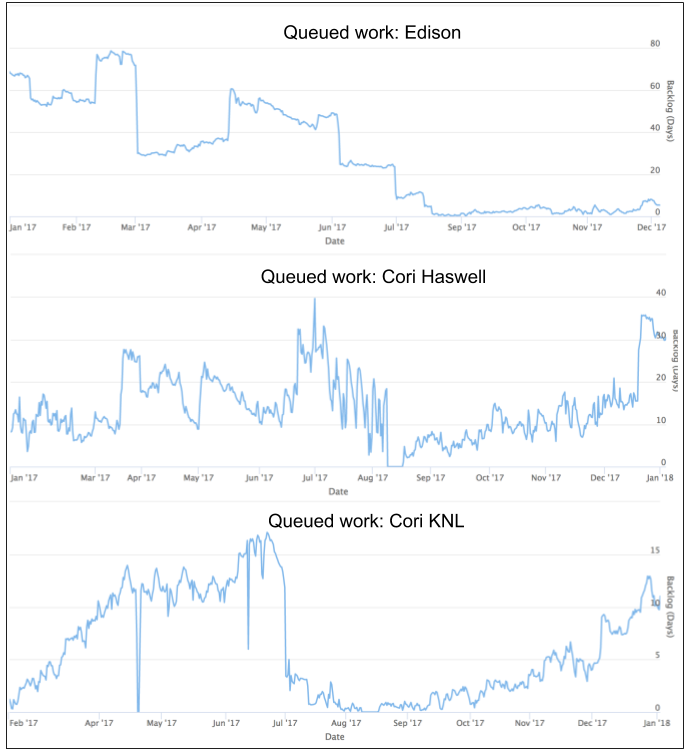
Figure 4. Queued work by system.
Areas of Highest Satisfaction
Security and network performance, filesystem uptime and reliability, NERSC communication with users, consulting services and account support had the highest satisfaction scores in 2017. With the exception of communications, which was a new survey section, these have traditionally received high satisfaction scores from users and in 2017 continued that trend.
Areas of Improved Satisfaction
Edison, the interactive queues, computing resources overall and software, especially for data analytics, visualization, workflow management and tools, saw the greatest improvements in satisfaction. The first three are likely a result of the increase in compute resources made available by the addition of nearly 10,000 KNL nodes to Cori, while software satisfaction likely reflects the rich stack NERSC has built around data analysis and NERSC’s effort to help vendors improve their code performance tools.
Areas of Decreased Satisfaction
The areas with the most significant reduction in satisfaction related to storage space on HPSS and /project, the ERCAP process, some consulting services and the NERSC web pages.
The satisfaction with storage space could be due to two key factors: the /project space constraints while we transition to a new Community Storage system; and limitations on HPSS space as we move to a new tape storage system to be located at NERSC in Berkeley.
The ERCAP process for submitting and awarding allocations at NERSC was reimplemented in a modern framework in 2017, using the ServiceNow cloud platform. This change is probably the cause of the reduced satisfaction with the ERCAP process in 2017. The new interface and workflow is being revised in collaboration with users and DOE program managers.
NERSC web documentation has had a reputation for technical thoroughness and quality but can be difficult to navigate and maintain, partly due to NERSC having built up so many pages on diverse topics over the years. In response, NERSC is preparing a new documentation site based on technologies that have been proven effective for technical documentation in the Open Source world, and we expect this will help us more easily organize and cross-link information. We expect this to enable improvements to the user experience of the NERSC website.