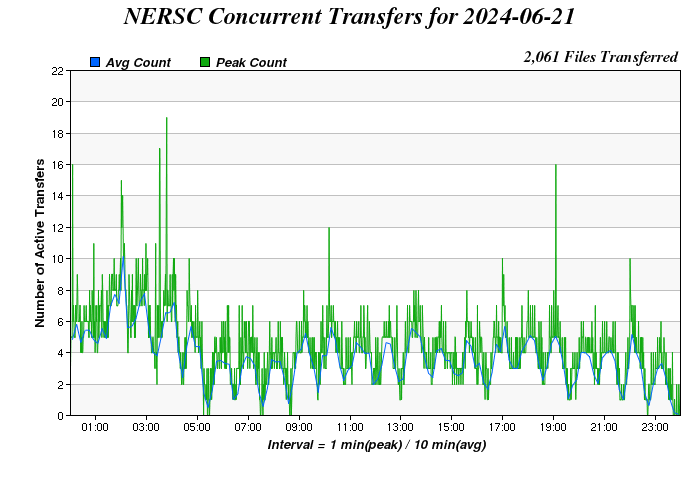
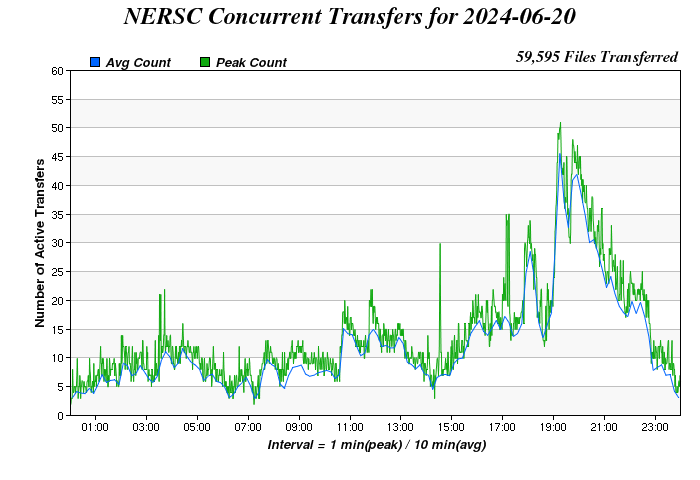
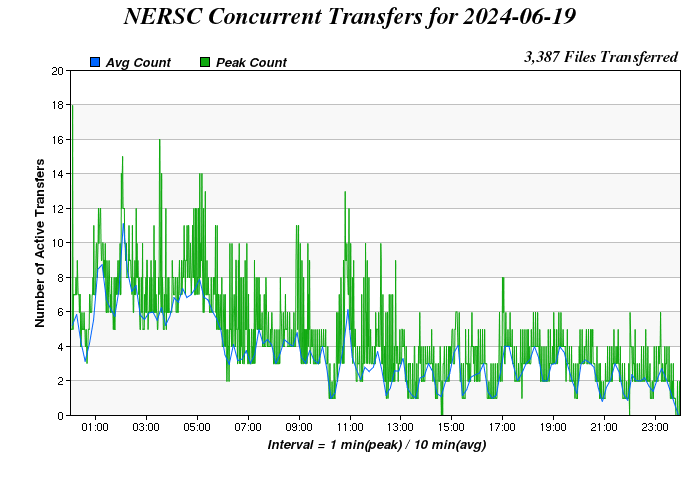
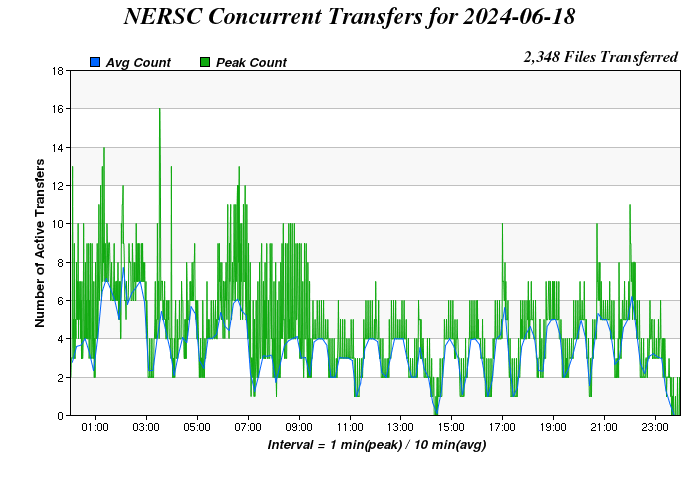
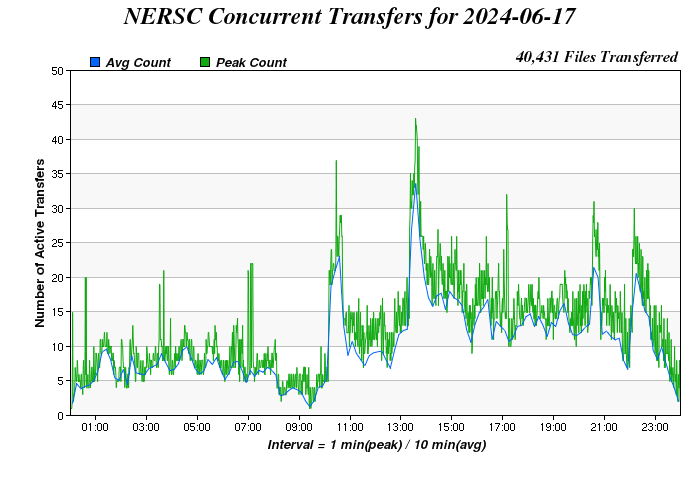
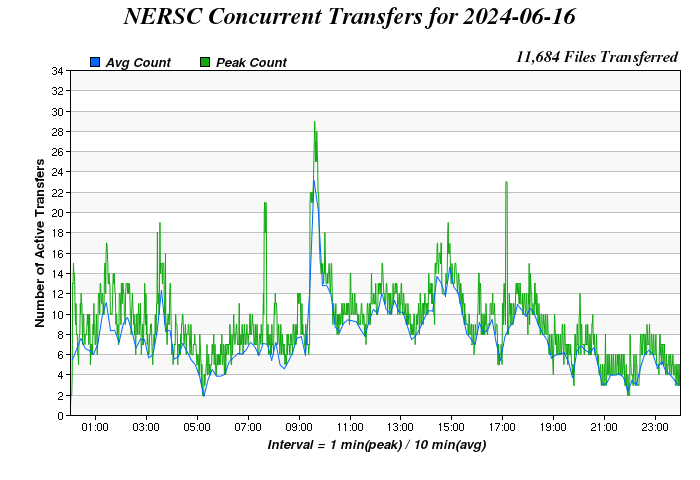
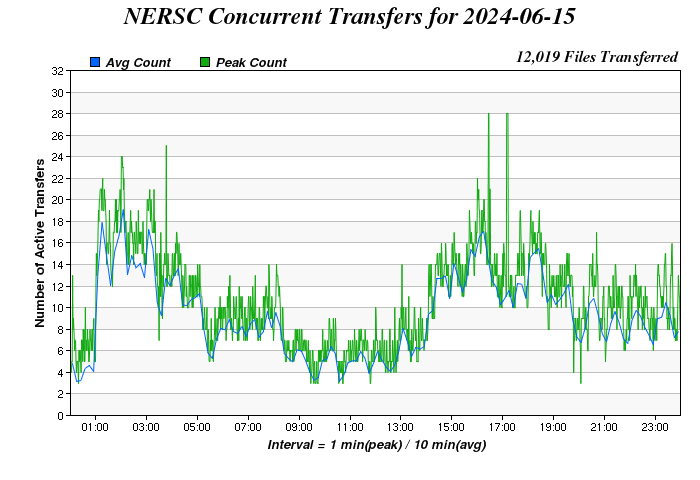
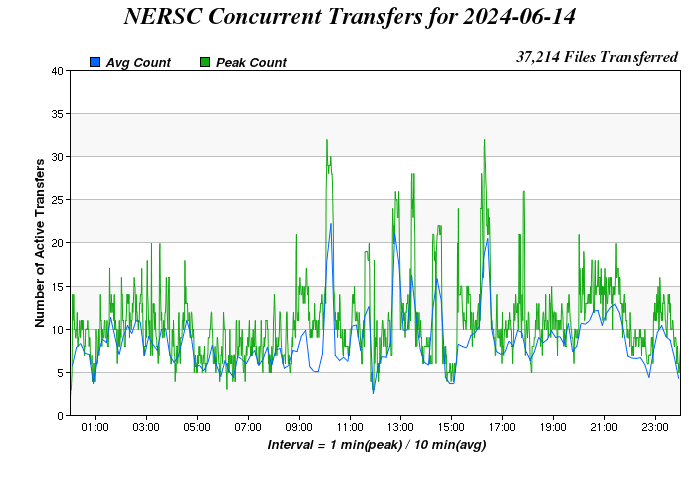
Concurrent Transfers Last 8 Days
The following plots show the concurrent transfer statistics for the past eight days, with the most recent day shown first.
Please note that graphs are autoscaling, so may not be directly comparable. Please check the scales on each axis before you compare graphs.