NERSCPowering Scientific Discovery for 50 Years

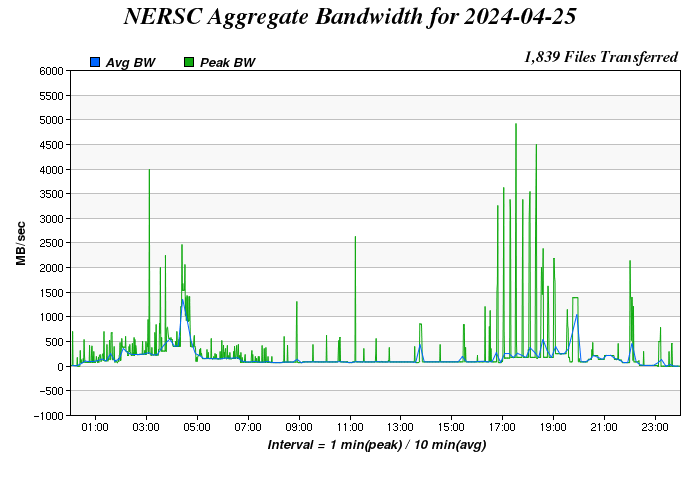
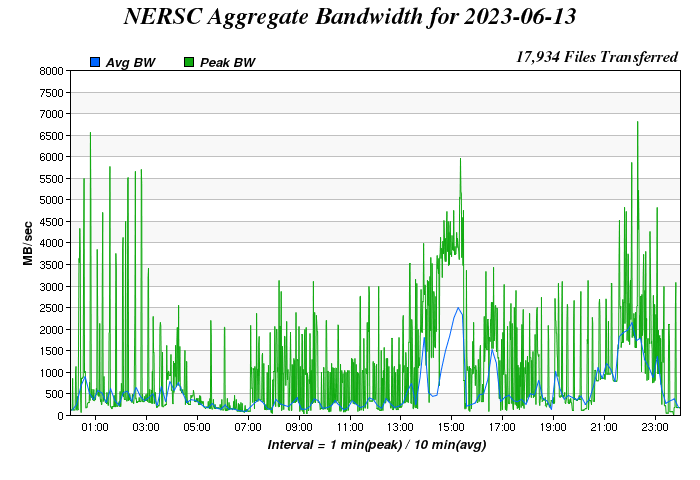
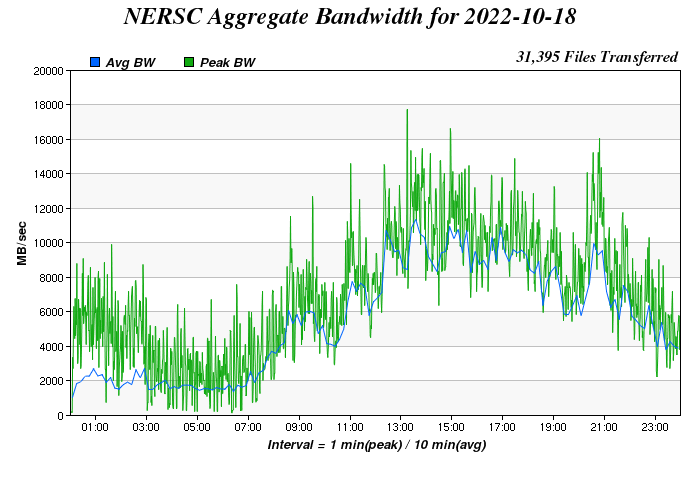
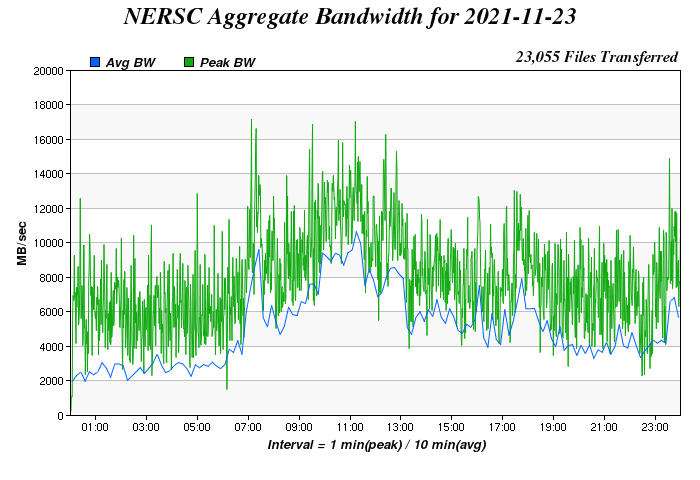
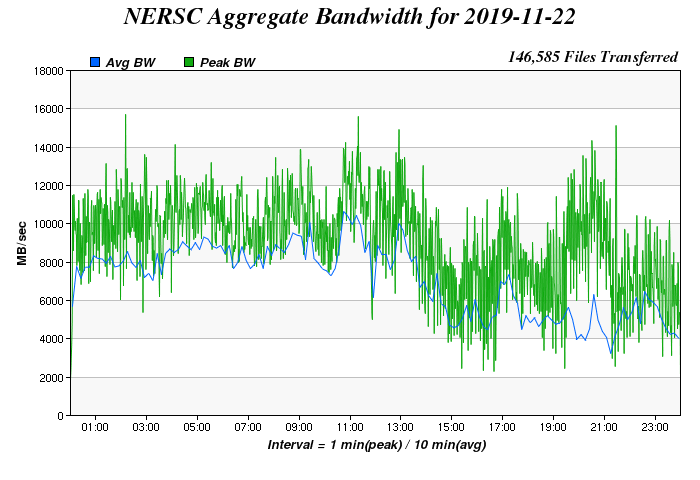
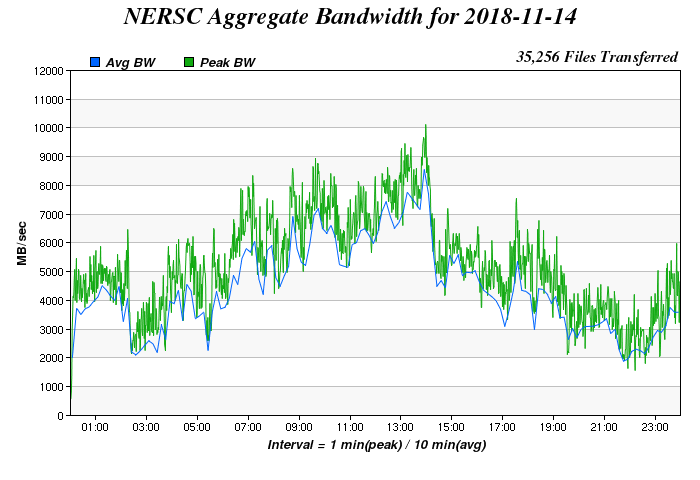
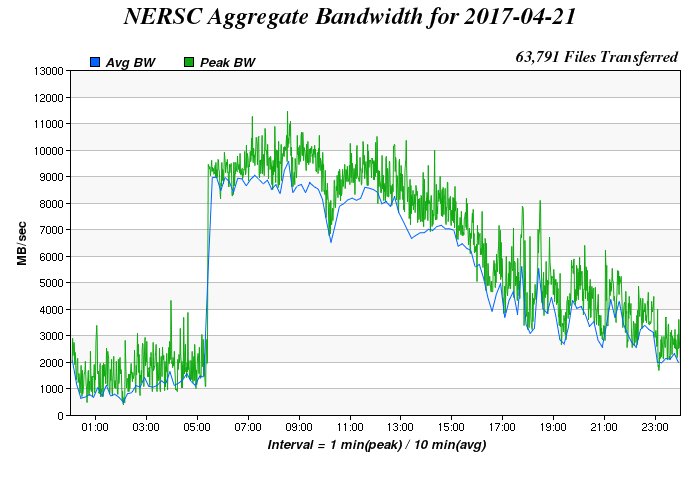
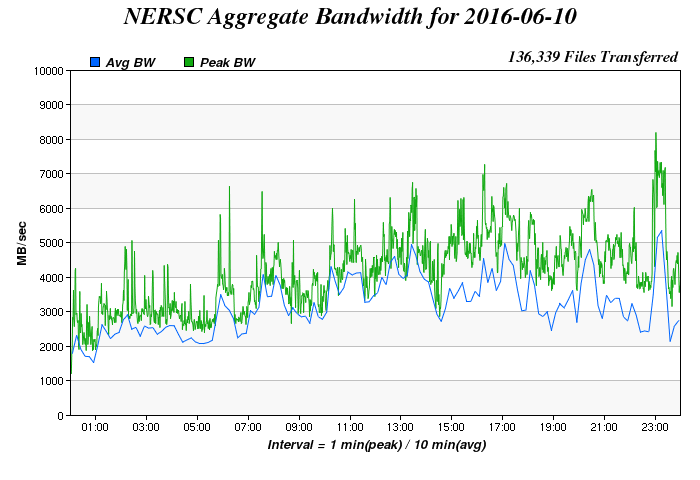
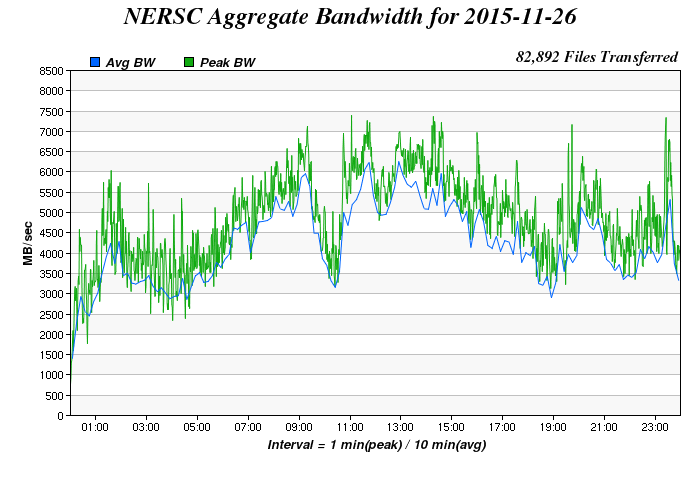
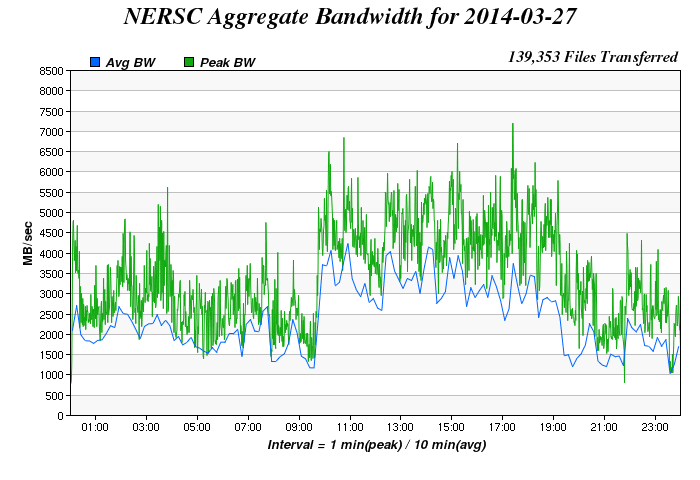
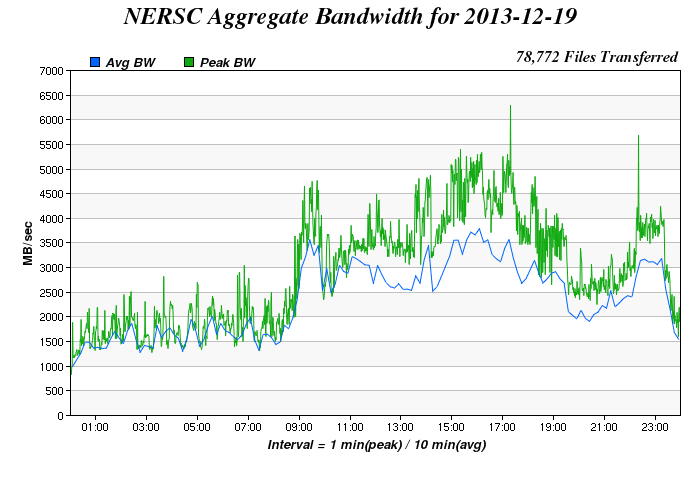
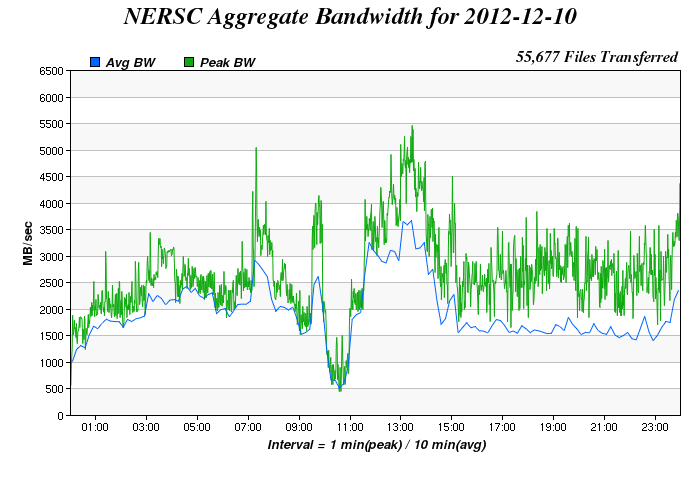
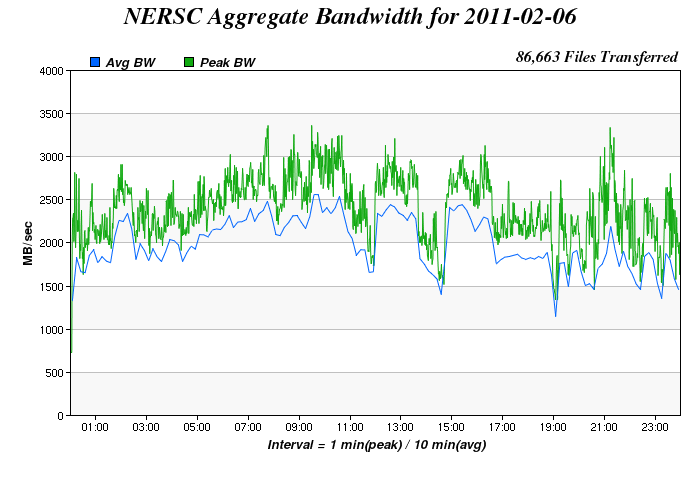
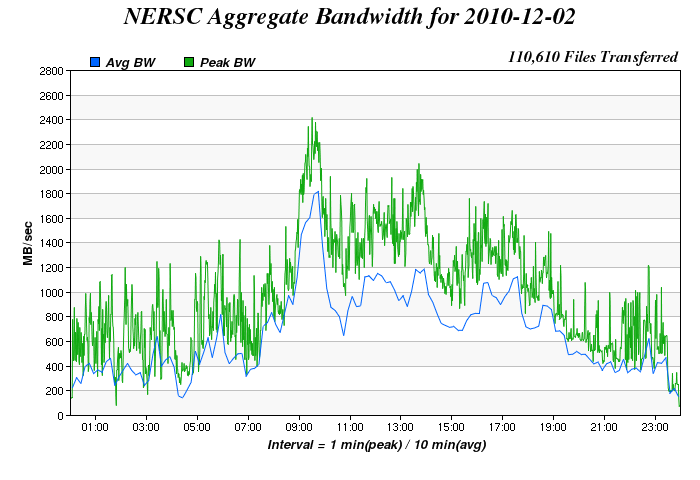
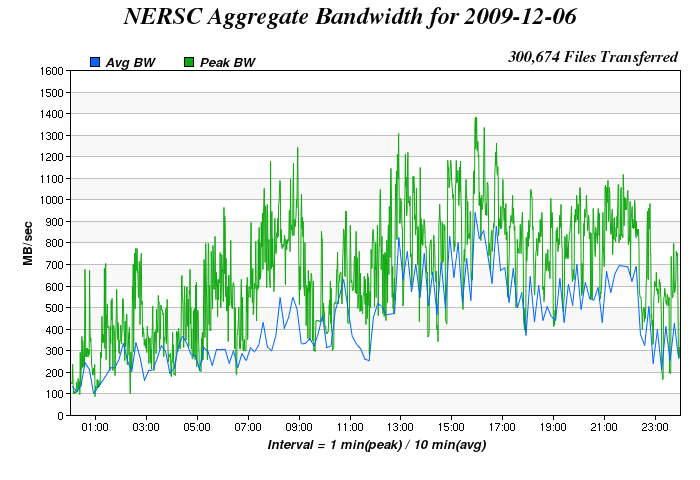
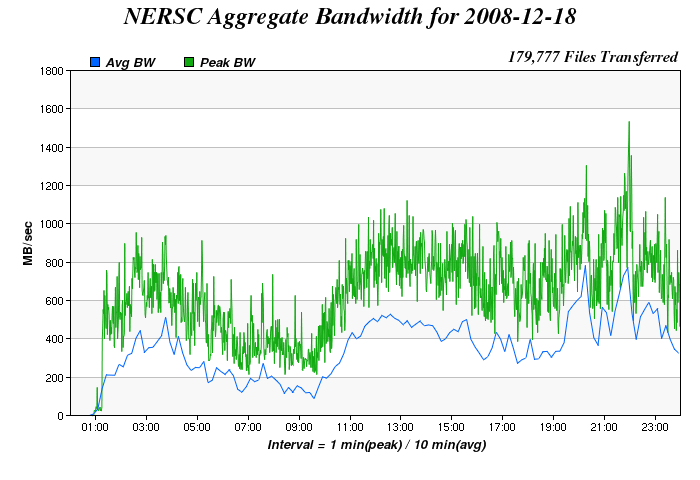
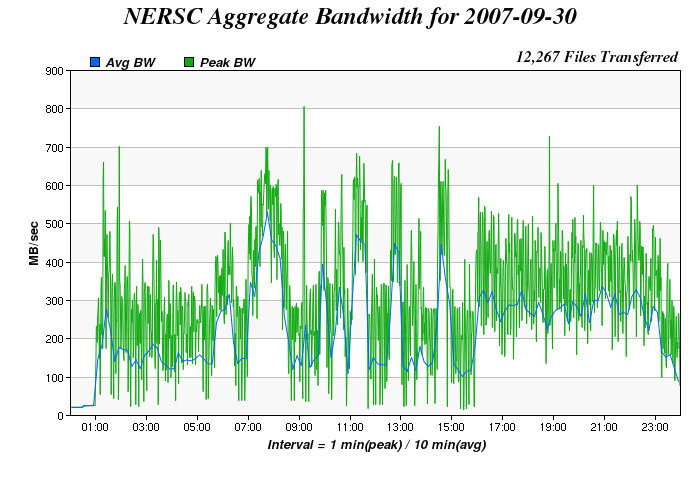
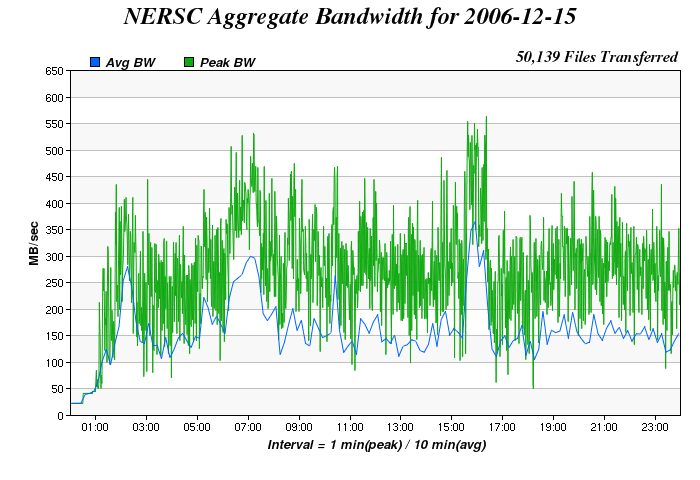
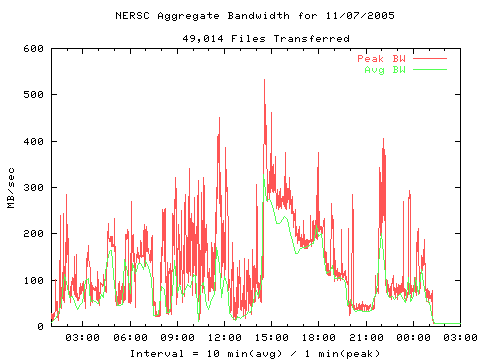
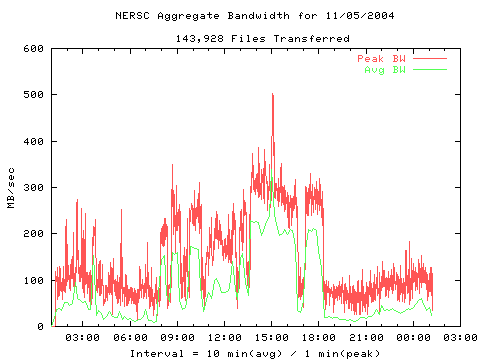
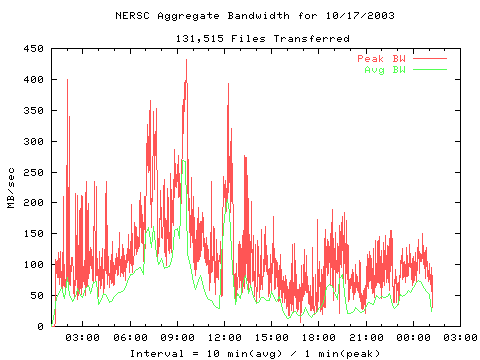
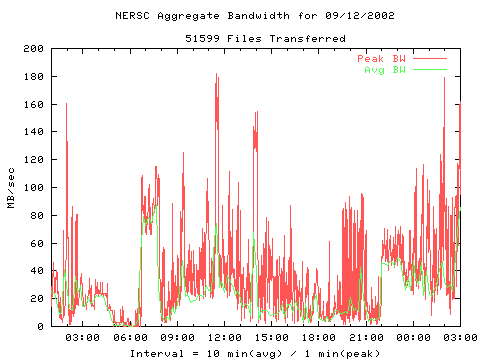
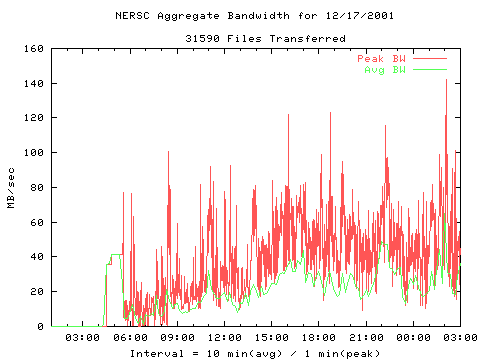
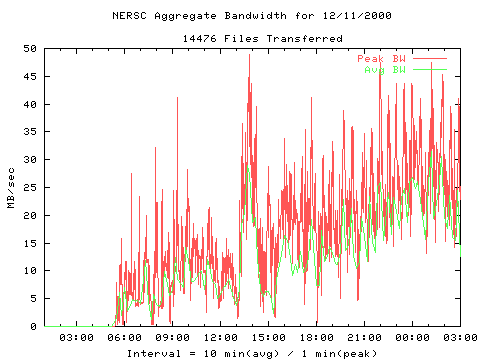
Aggregate Transfers Historical Yearly Peak

The following plots show the yearly peak days from 2000 to the present.

Please note that graphs are autoscaling. Check the scales on each axis before comparing graphs.

Note that the graph for the current year shows the data for the year-to-date peak.


Daily Aggregate Bandwidth


Daily Aggregate Bandwidth


Daily Aggregate Bandwidth


Daily Aggregate Bandwidth


Daily Aggregate Bandwidth


Daily Aggregate Bandwidth


Daily Aggregate Bandwidth


Daily Aggregate Bandwidth


Daily Aggregate Bandwidth


Daily Aggregate Bandwidth


Daily Aggregate Bandwidth


Daily Aggregate Bandwidth


Daily Aggregate Bandwidth


Daily Aggregate Bandwidth


Daily Aggregate Bandwidth


Daily Aggregate Bandwidth


Daily Aggregate Bandwidth


Daily Aggregate Bandwidth


Daily Aggregate Bandwidth


Daily Aggregate Bandwidth


Daily Aggregate Bandwidth


Daily Aggregate Bandwidth


Daily Aggregate Bandwidth


Daily Aggregate Bandwidth


Daily Aggregate Bandwidth