Bandwidth and Transfer Activity
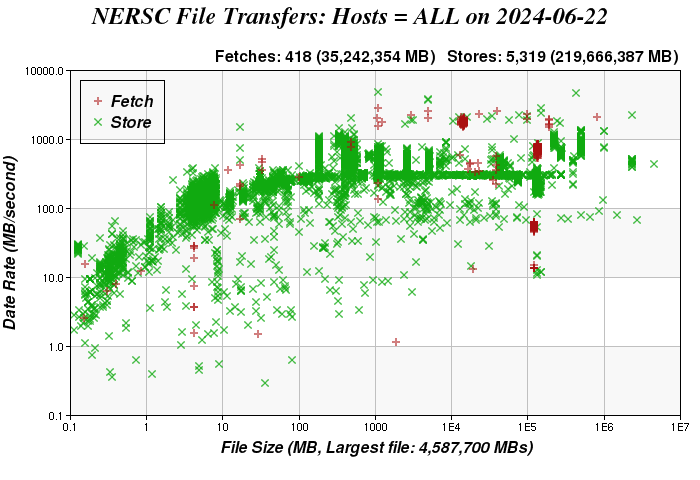
Data Rate vs. File Size
The graph below shows the bandwidth for individual file transfers for one day. The graph also gives a quick overview of the traffic and maximum bandwidth and file size for a given day.
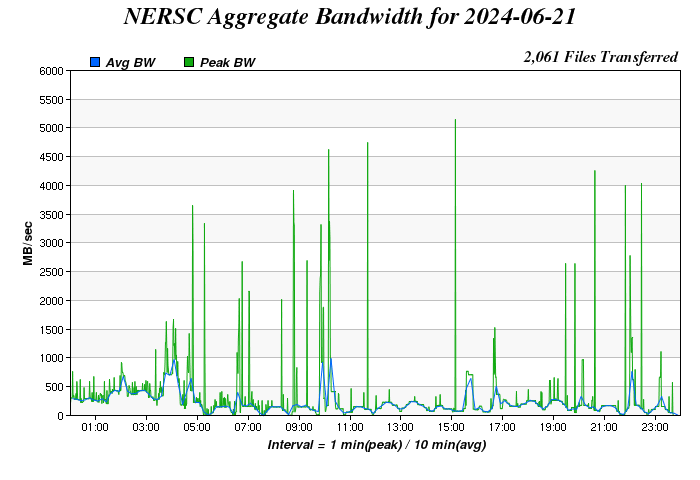
Aggregate Transfer Bandwidth
This graph shows the aggregate transfer rate to the storage systems as a function of time of day. The red line is the peak bandwidth observed within each one minute interval. The green line is the average over ten minute intervals.
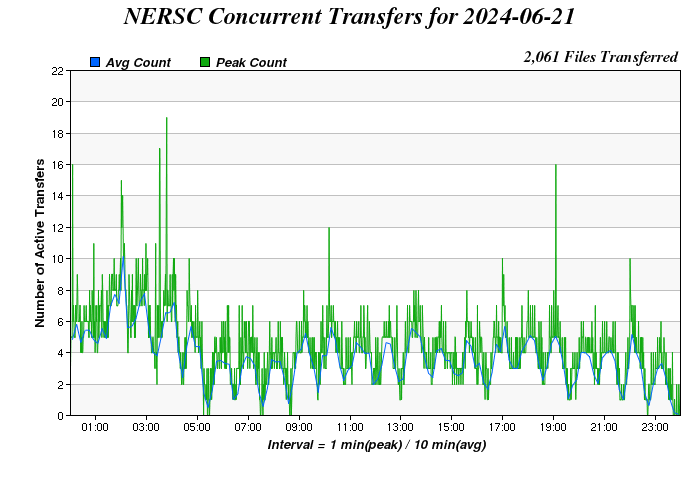
Concurrent Transfers
The third graph shows the number of concurrent transfers to the storage systems. The peak within each minute is shown, as well as a ten-minute average.
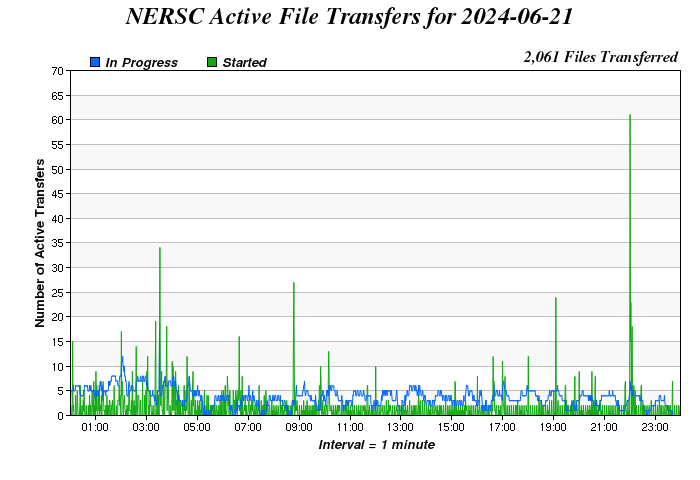
Transfer Activity
This graph shows the number of transfers to the storage systems that are initiated each minute. Most of these complete in just a few seconds, so only a few transfers are still in progress at the end of the minute. The transfers still in progress at the end of the minute are shown in green. The transfers in progress at the end of the minute are concurrent, so the green line is similar to the values shown in the graph above on concurrency.