NERSCPowering Scientific Discovery for 50 Years

HPSS Yearly Network Traffic


Yearly Summary of I/O Traffic Between Storage and Network Destinations

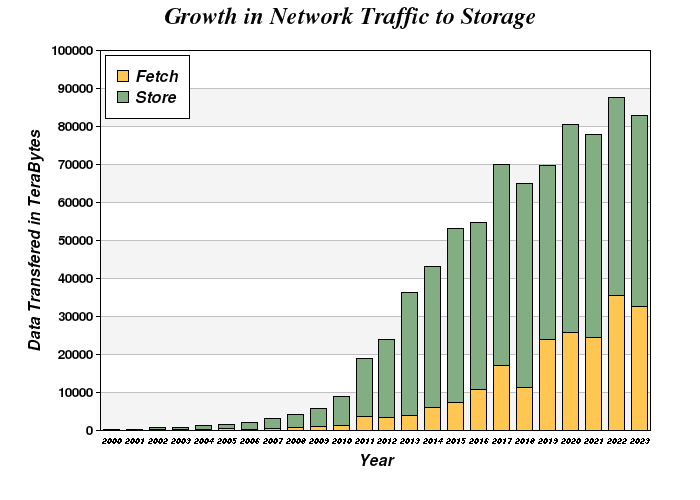
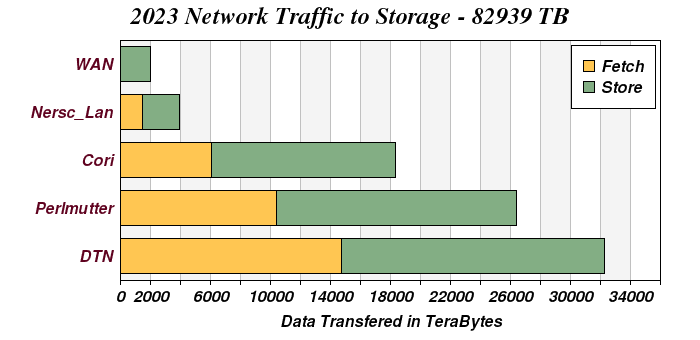
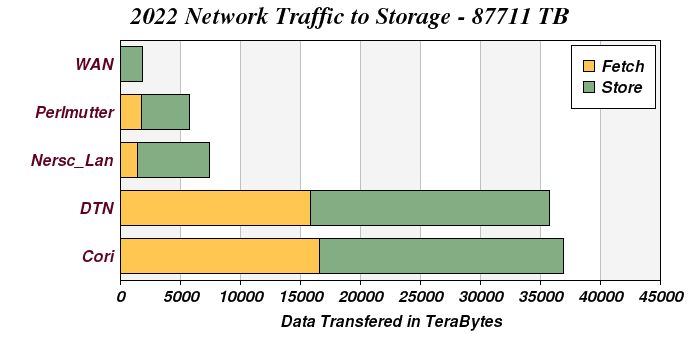
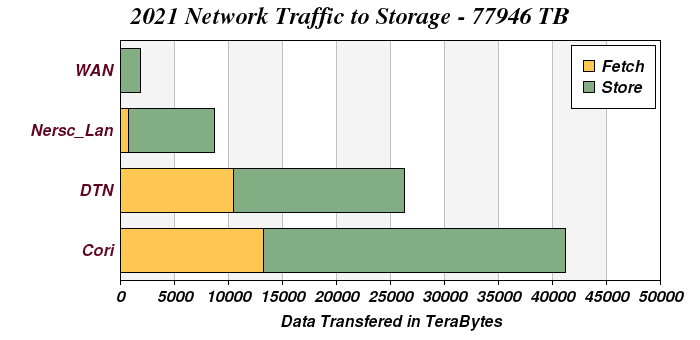
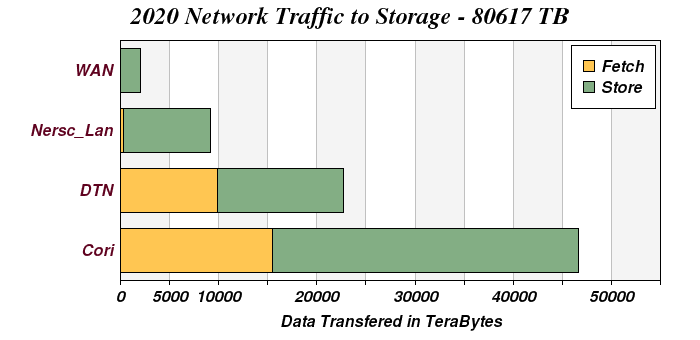
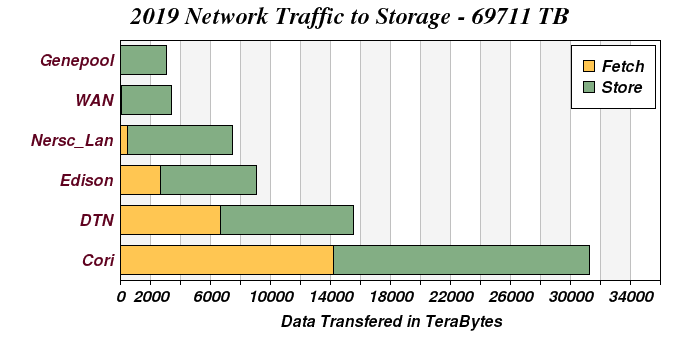
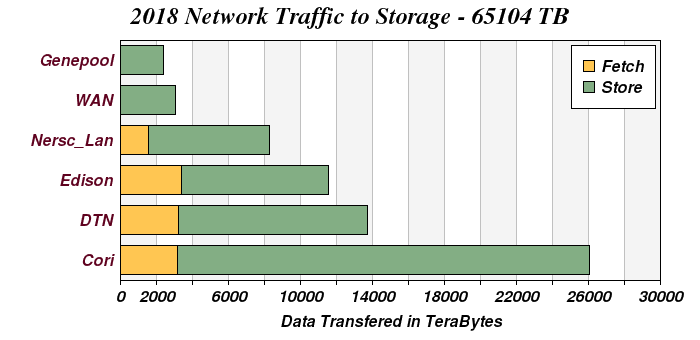
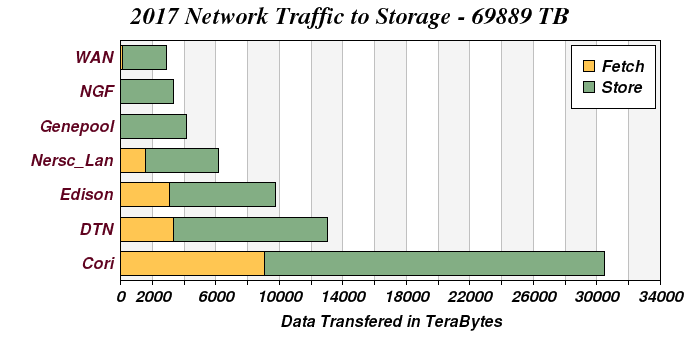
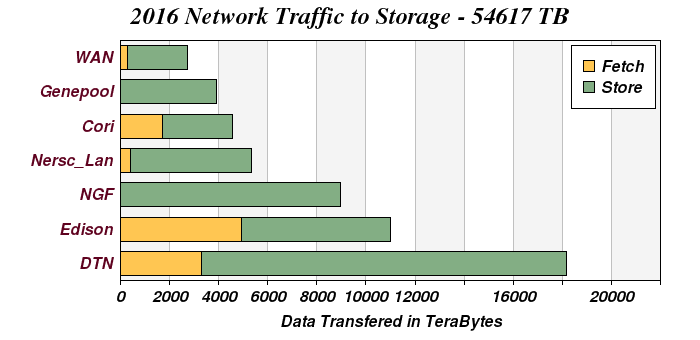
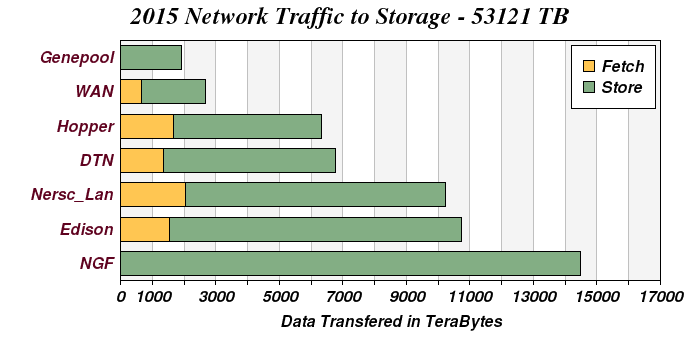
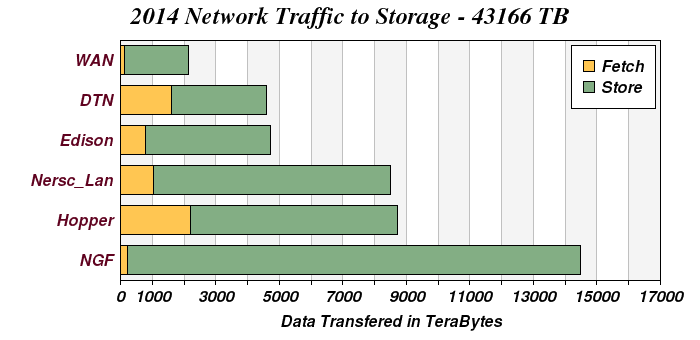
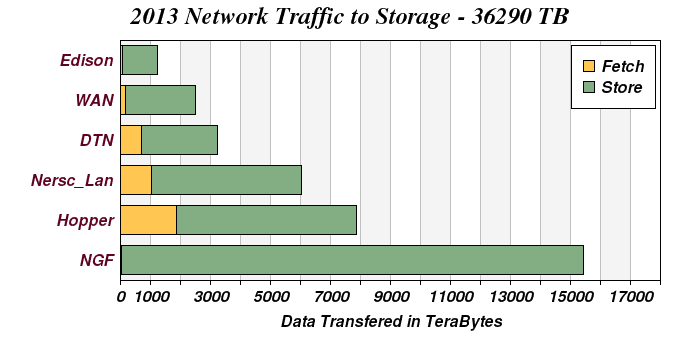
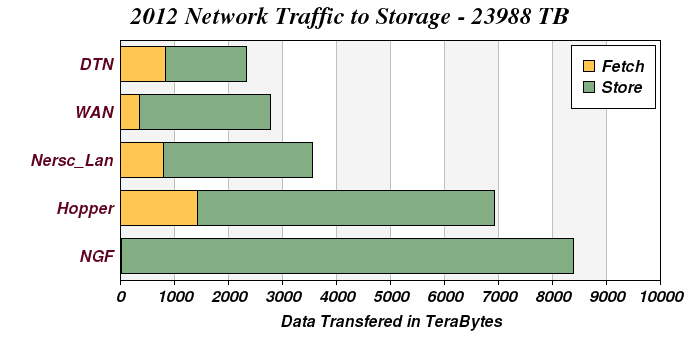
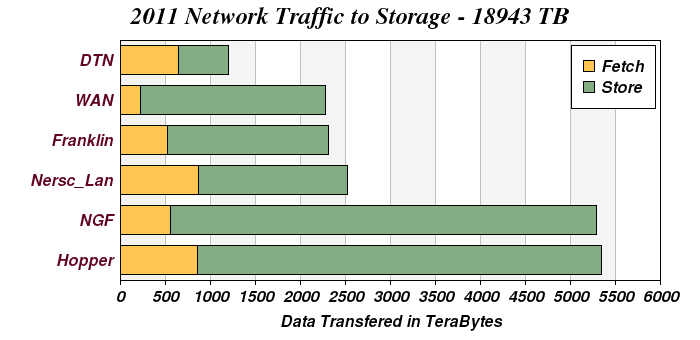
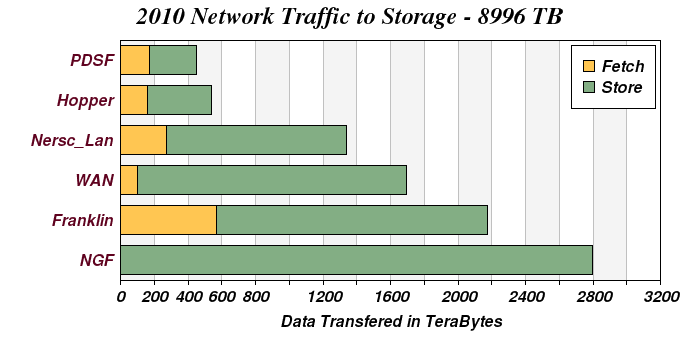
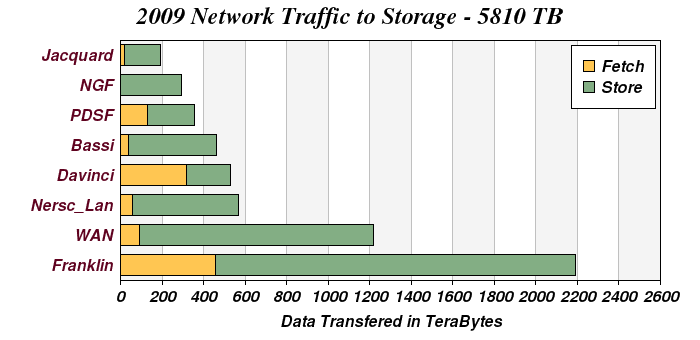
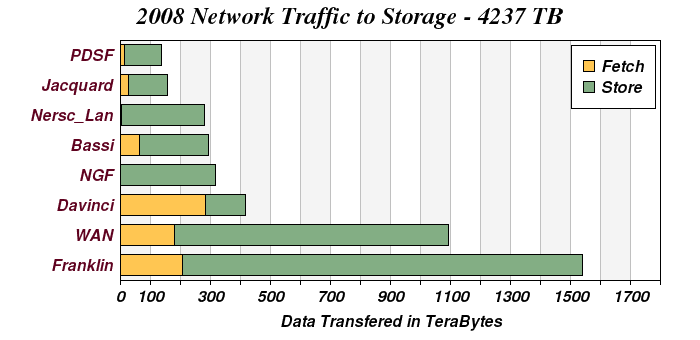
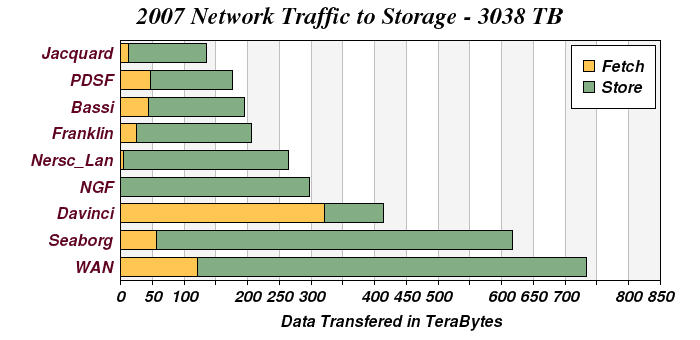
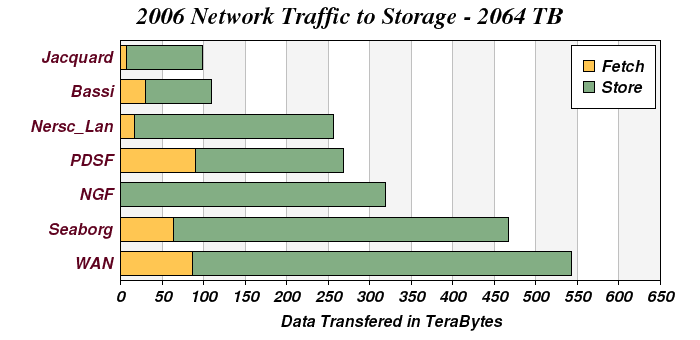
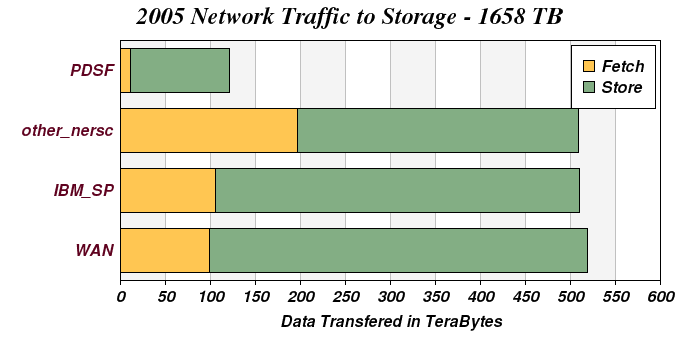
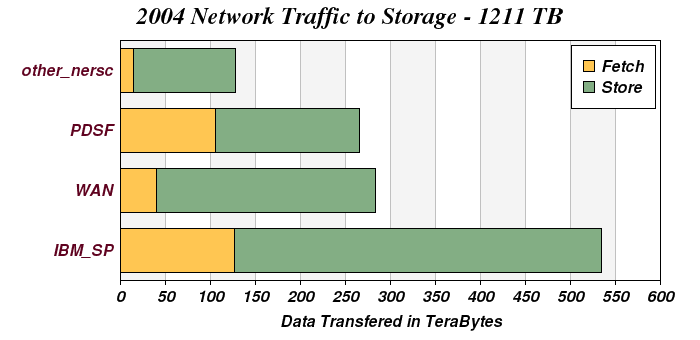
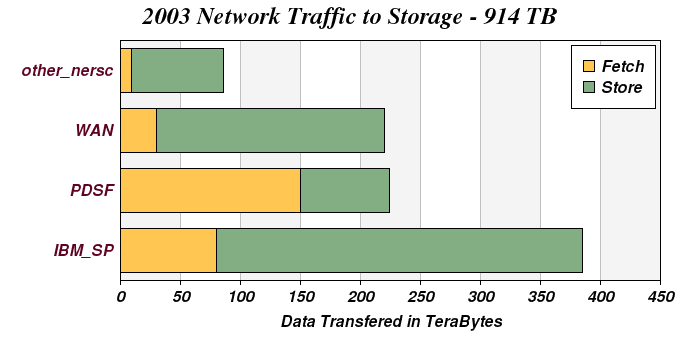
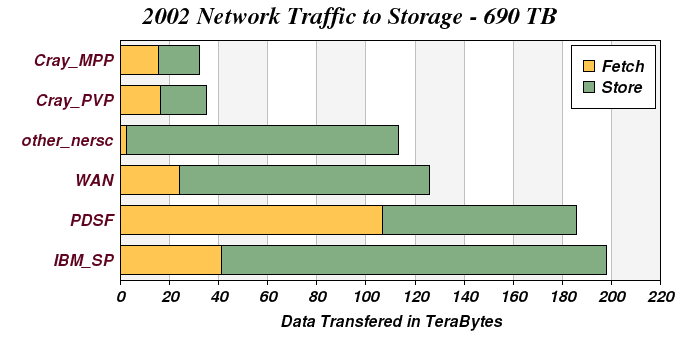
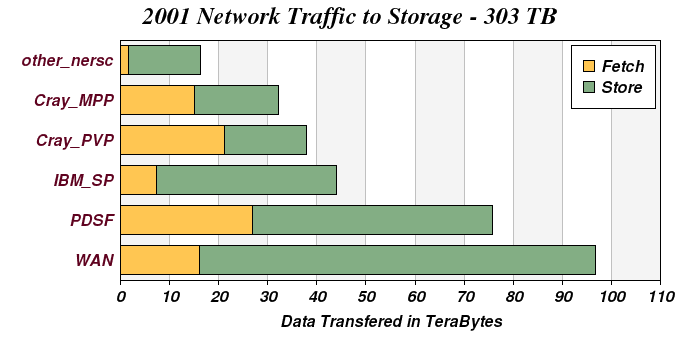
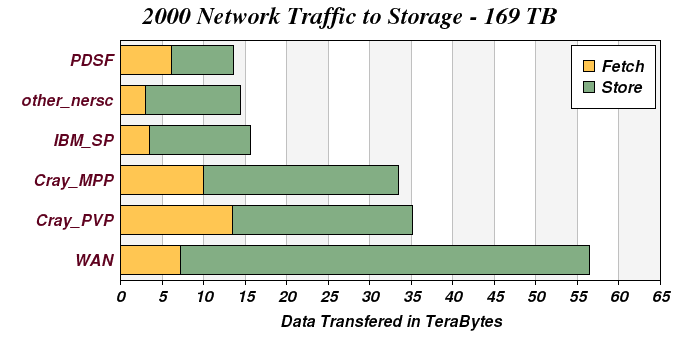
These bar charts show the total transfer traffic for each year between storage and network destinations (systems within and outside of NERSC).

Traffic for the current year is an estimate derived by scaling the known month’s traffic up to 12 months. The years shown are calendar years. The first graph shows the overall growth in network traffic to storage over the years.


Network Traffic Growth


Network Distribution 2023


Network Distribution 2022


Network Distribution 2021


Network Distribution 2020


Network Distribution 2019


Network Distribution 2018


Network Distribution 2017


Network Distribution 2016


Network Distribution 2015


Network Distribution 2014


Network Distribution 2013


Network Distribution 2012


Network Distribution 2011


Network Distribution 2010


Network Distribution 2009


Network Distribution 2008


Network Distribution 2007


Network Distribution 2006


Network Distribution 2005


Network Distribution 2004


Network Distribution 2003


Network Distribution 2002


Network Distribution 2001


Network Distribution 2000