


NOAA Releases Extended Version of 20th Century Reanalysis Project
New climate dataset, stored at NERSC and publicly available for research, dates back to 1806
January 13, 2020
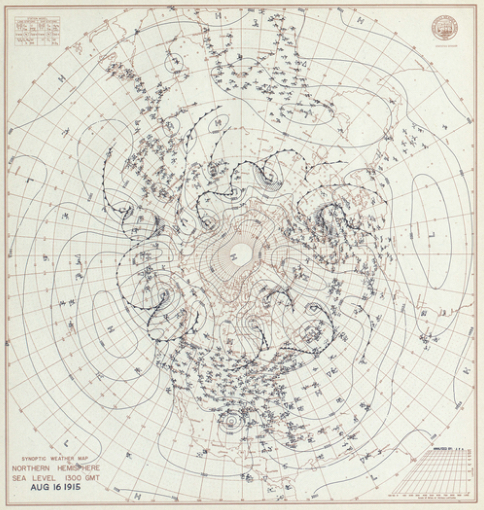
This U.S. Weather Bureau Map depicts northern hemisphere circulation patterns on Aug. 16, 1915, as the Galveston hurricane made landfall on the Texas coast. Surface pressure observations from historic weather records like this allow scientists to reconstruct global weather using modern weather models. Credit: NOAA
Calling it a time machine for weather data and a treasure trove for climate researchers, the National Oceanic and Atmospheric Administration (NOAA) has released an updated version of the 20th Century Reanalysis Project (20CRv3) - a high-resolution, four-dimensional reconstruction of the global climate that estimates what the weather was every day back to 1806.
The release of this latest 20CRv3 data comes on the heels of an October 2019 release of data going back to 1836. Together, these new updates provide continuous estimates of the most likely state of the global atmosphere’s weather on 75-kilometer grids eight times a day for the past 200+ years. It’s the scientific fruit of an international effort led by researchers with NOAA's Physical Sciences Division and CIRES and is supported by NOAA and the U.S. Department of Energy, including supercomputing resources at the National Energy Research Scientific Computing Center (NERSC) at Lawrence Berkeley National Laboratory.
“The research opportunities this work makes available are almost boundless,” noted Gil Compo, a CIRES scientist working at NOAA who leads the reanalysis project and is a long-time NERSC user. “We’re throwing open the door to lost history and inviting scientists to pour through.”
Using NOAA’s Global Forecast System, researchers reconstructed the global atmosphere from surface pressure readings, sea temperature, and sea ice observations from archival records – some transcribed by citizen volunteers through the Old Weather project – including logbooks from 19th century ships. From this data, the model estimates multiple factors, such as temperature, pressure, winds, moisture, solar radiation, and clouds.
Scientists have used previous 20th Century Reanalysis datasets as a foundation for a range of studies, from validating climate model variability to understanding large-scale climate trends to diagnosing the impacts of individual historical extreme weather events. The dataset allows researchers to explore how climate change is influencing temperature, precipitation, and atmospheric circulation.
“This tool also lets us quantitatively compare today’s storms, floods, blizzards, heat waves, and droughts to those of the past and figure out whether or not climate change is having an effect,” Compo said. “This should be useful for climate attribution research.”
A big appetite for big data
The 20CR Project has been computing at NERSC since 2007, initially through an Incite11 project, "Surface Input Reanalysis for Climate Applications (SIRCA) 1850-2011." NERSC has also supported this research via the NERSC Initiative for Scientific Exploration and the NERSC Director's Reserve, including 120 million NERSC hours in 2018 through the NERSC High-Impact Science at Scale program.
In addition to providing new insights into weather patterns and climate change, previous versions of the dataset have helped discover unknown hurricanes, study the climate impact of old volcanic eruptions, investigate the timing of bird migrations, and explore the economic impact of diseases spread by the tsetse fly in sub-Saharan Africa. But this latest update incorporates millions more observations than previously possible, especially for earlier periods, including up to 25 percent more available observations for years prior to 1930. The result? A three-dimensional model of the weather from the surface of the Earth to the level of the jet stream that includes 80 separate ensemble members, including wind, temperature, humidity, pressure, clouds, precipitation, snow cover, and radiative fluxes every three hours.
“The atmospheric estimates from 20CRv3, as well as their uncertainties, are much more reliable than those from the previous reanalysis, particularly in the 19th century,” said Laura Slivinski, a CIRES meteorologist and the lead author of a recent paper in the Quarterly Journal of the Royal Meteorological Society that lays out improvements in their reanalysis techniques. “We’re more certain about how much we know, and where we need to know more.” Slivinski is giving a talk on this project on Tuesday, January 14, in Boston, Mass. at the American Meterological Society annual meeting during the IOAS-AOLS sessions.
Running the model and analyzing the massive amounts of new data required astronomical computing resources, and this is where NERSC comes in. So far 20CRv3 has used 600 million CPU hours on 6,600 cores of the Cori KNL supercomputer to crunch 21 million gigabytes of data - more than 10 times the number of compute hours needed with previous versions. The 20CRv3 dataset, which is publicly available, is housed at NERSC on the High Performance Storage System, enabling scientists from all over the world to access it via the NERSC Science Gateway and mine it for all kinds of research.
“We needed many more NERSC hours because we now have 80 ensemble members at four times the horizontal resolution, 2.5 times the vertical resolution, and two times the temporal frequency,” Compo explained. “We used to be on a 2-degree latitude-by-longitude grid; we’re now on a 0.7-degree latitude-by-longitude grid, which means we went from a grid spacing of about 140 miles to 48 miles. So yes, we are doing more science.”
In this most recent expansion of the dataset, two events stand out, Compo noted: the 1815 eruption of Mount Tambora - the largest known volcano in recorded history - and the ice core record for volcanic aerosols resulting from an earlier volcano. “There was a volcano about the size of Tambora called ‘the mystery volcano of 1808-09,’” he said. “We wanted to see if we could see any effects from that eruption as well.”
Having more ensemble members, higher resolution, and higher output frequency will improve researchers’ understanding of extreme events, particularly hurricanes and extreme storms; more accurately quantify their uncertainties; and better understand how they are changing in response to global climate change, he added. Earlier time periods, especially in the Southern hemisphere, still have high uncertainty. Luckily, the data being collected and analyzed by this project and its many supporters can help fix that.
“This dataset will keep getting better as we unlock more observations from historical archives,” Compo said. “It’s really a virtuous circle.”
The 20th Century Reanalysis Project version 3 dataset received support from the DOE Office of Science Biological and Environmental Research Program Office, NOAA’s Earth System Research Laboratory Physical Sciences Division, and NOAA's Climate Program Office.
This article uses information from a news release published by the National Oceanic and Atmospheric Administration in October 2019.
About NERSC and Berkeley Lab
The National Energy Research Scientific Computing Center (NERSC) is a U.S. Department of Energy Office of Science User Facility that serves as the primary high performance computing center for scientific research sponsored by the Office of Science. Located at Lawrence Berkeley National Laboratory, NERSC serves almost 10,000 scientists at national laboratories and universities researching a wide range of problems in climate, fusion energy, materials science, physics, chemistry, computational biology, and other disciplines. Berkeley Lab is a DOE national laboratory located in Berkeley, California. It conducts unclassified scientific research and is managed by the University of California for the U.S. Department of Energy. »Learn more about computing sciences at Berkeley Lab.