


Creating a World of Make-Believe to Better Understand the Real Universe
Researchers design mock galaxies and more to prepare for sky-mapping instrument
December 14, 2017
By Glenn Roberts
Contact: cscomms@lbl.gov
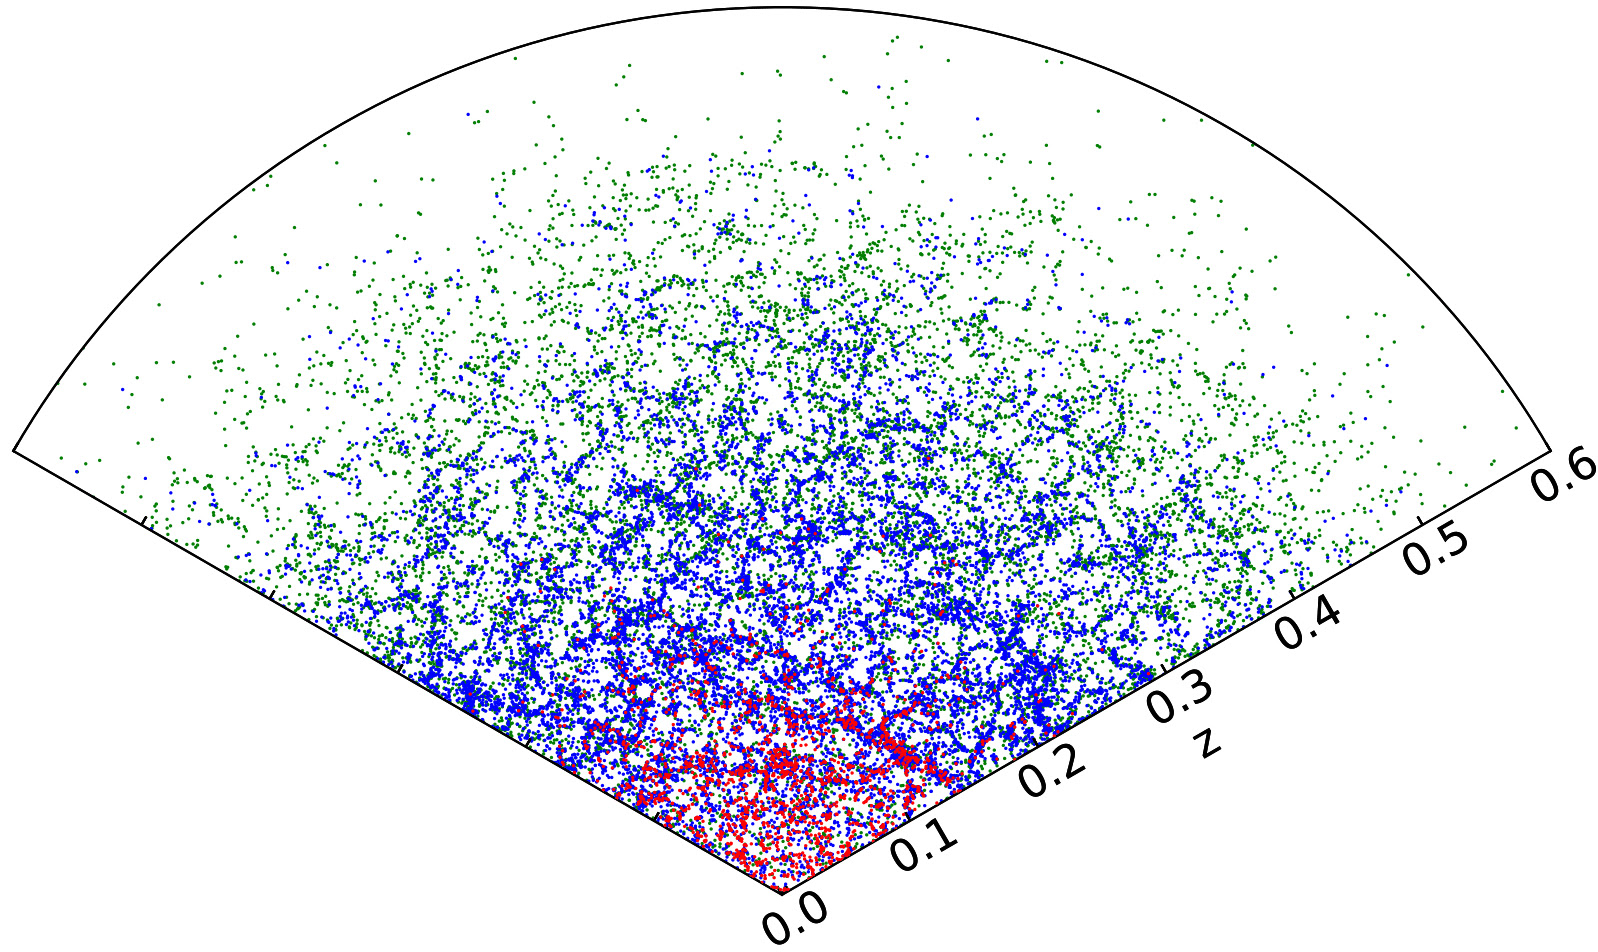
This plot shows a thin slice through a mock galaxies catalog. The blue and green points are “bright” and “faint” galaxies simulated for the Dark Energy Spectroscopic Instrument’s Bright Galaxy Survey, and the red points show galaxies that are brighter than the magnitude limit of the Sloan Digital Sky Survey, a predecessor sky survey. (Credit: Alex Smith/Durham University)
Seeing is believing, or so the saying goes.
And in some cases, a world of make-believe can help you realize what you’re actually seeing, too.
Scientists are creating simulated universes, for example – complete with dark matter mock-ups, computer-generated galaxies, quasi quasars, and pseudo supernovae – to better understand real-world observations.
Their aim is to envision how new Earth-based and space-based sky surveys will see the universe, and to help analyze and interpret the vast treasure troves of data that these surveys will amass.
“We want to be able to hit the ground running once we get real data,” said Stephen Bailey, a physicist at the Department of Energy’s Lawrence Berkeley National Laboratory (Berkeley Lab) who is the technical lead and manager of data systems for a 3-D sky-mapping project known as the Dark Energy Spectroscopic Instrument, or DESI, that is slated to begin observing in 2019.
Several DESI teams are building out separate simulations populated with the many types of objects DESI will encounter. “What is this going to look like for DESI?” Bailey asked. “What is the actual spectra, or light signature, that DESI is going to observe? We have to make sure the mock objects have the right colors and chemical abundances.”
John Moustakas, an assistant professor of physics at Siena College in New York who is also working on the simulations for DESI, added, “And that’s challenging because nothing like DESI exists.”
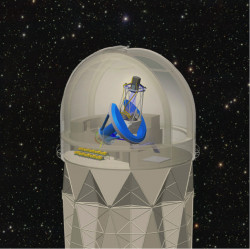
The Dark Energy Spectroscopic Instrument (DESI), shown in this illustration, will be mounted on the 4-meter Mayall telescope at Kitt Peak National Observatory near Tucson, Ariz. It will collect data on light from 35 million galaxies and quasars to make the biggest 3-D map of the universe ever. (Credit: R. Lafever, J. Moustakas/DESI Collaboration)
The computerized models are informed by observations from previous surveys and by large-scale simulations of the universe that account for complex physics including dark matter, an unknown form of matter that, together with dark energy, makes up about 95 percent of the total mass and energy in the universe.
“To the greatest extent possible, the simulations are based on models of real objects – from pulling out all of these pieces from other surveys,” Moustakas said. “Perhaps in a perfect world these would be purely theoretical models, but we don’t understand galaxies well enough to be able to do that.”
And even though there is data from previous surveys, DESI will see the sky in a different way. “You have to extract out all the instrument parts of all these other surveys to get to: ‘This is what other galaxies look like, intrinsically,’” he said. Next, he said, scientists must figure out how DESI’s unique set of instruments will see them.
The simulated objects and universes created and refined using powerful supercomputers, including Berkeley Lab’s National Energy Research Scientific Computing Center (NERSC), must ultimately take into account the Earth’s atmospheric noise, and weather and lighting conditions including the phases of the moon, which all affect observations.
DESI will operate from the Nicholas U. Mayall 4-Meter Telescope at Kitt Peak National Observatory in Arizona. It will measure the light from tens of millions of galaxies and other objects with a carefully choreographed array of 5,000 swiveling robots – each pointing a fiber-optic cable at a targeted space object. The robotic array will cycle through a sequence of objects, peering up to 11 billion years back in the history of our universe.
The light captured by DESI will provide precise measurements that will help scientists to retrace the evolution of the universe and learn more about dark energy, which is responsible for the universe’s mysterious, accelerating expansion. Berkeley Lab is the lead lab for the DESI project, and the collaboration now involves about 200 scientists at 40 institutions.
Alex Smith, a graduate student at Durham University in England and a DESI collaboration member, worked with a team to develop a mock catalog of galaxies for DESI that taps into a powerful simulation of how the universe’s matter has evolved over the past 13 billion years.
Carried out at the Jülich Supercomputer Center in Germany, this Millennium-XXL simulation used 12,000 computer cores – the equivalent to about 300 years’ worth of computer processing time. It generated about 100 terabytes of data, which is nearly as much data as the Hubble Space Telescope transmitted in space images during its first 24 years of operation.
The mock galaxy catalog that Smith’s team developed focused on the same one-third of the sky that DESI will survey. The catalog shows how galaxies’ clustering and ‘redshift’ – the color based on their distance and movement away from us – changes over time and will likely appear to DESI.
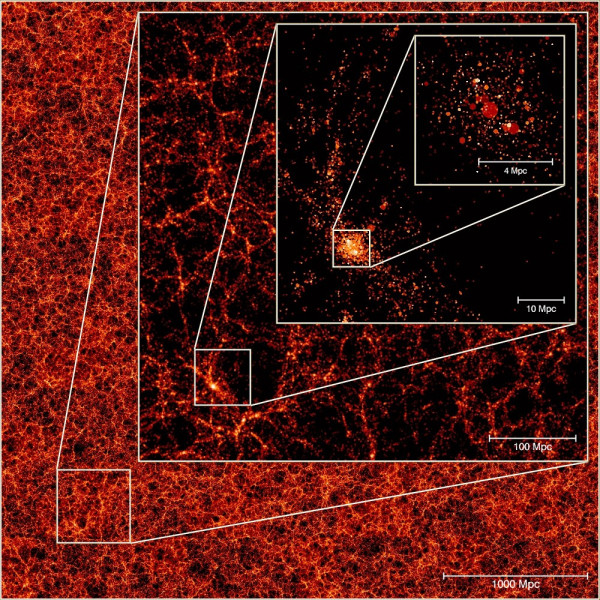
The predicted galaxy distribution in the Millennium XXL simulation. Each galaxy is represented by a sphere whose intensity and size are related to the expected total mass in stars and the size of its cold gas disk. Measurements are in megaparsecs – 1 megaparsec equals 3.3 million light-years. (Credit: Max-Planck-Institute for Astrophysics)
Due to cosmic expansion, very distant objects appear redder and fainter. Earlier mock catalogs had not accounted for these changes in redshift, Smith said.
“It’s important to have mock catalogs that have realistic properties – that look similar to how we think the actual survey is going to look,” he added.
His team’s survey used a method known as halo occupation distribution, or HOD, to model the average number of galaxies and their brightness based on the Millennium-XXL survey’s detailed simulations of the distribution of dark matter. In dark matter models, matter forms within clumps of dark matter known as halos, and galaxies are enveloped by these halos.
Smith noted that the distribution of galaxies within these halos, and other properties incorporated in the latest catalog, are taken from data collected in past surveys, including the Sloan Digital Sky Survey and the Galaxy and Mass Assembly Survey.
The galaxies in the catalog are simplified to their brightness, as it will appear in one of the wavelength bands that DESI will be scanning. The mock catalog is also intended to simulate the type of galaxies that will be targeted during sky conditions that favor brighter objects, such as those that exist around the times of sunrises and sunsets, or when the moon is brighter in the sky, for example. Separate simulations will account for darker viewing conditions.
“The mock catalog I created assumes you can observe everything with perfect precision,” Smith noted, so additional properties will need to be added to simulate weather and other effects. The DESI collaboration has access to a decade of weather statistics collected at the Kitt Peak National Observatory, Bailey said.
Even after the start of DESI’s survey, collaboration scientists will continue to adapt and improve the models.
“There is a learning component to it,” Moustakas said. “As we start to observe things, we will then use those targeted objects to build better models of what those objects are.”
Relying too much on simulations can also be a problem, DESI scientists noted, so observations will provide a needed reality check. For example, superbright objects called quasars, which are among the targets for DESI, have been particularly difficult to simulate.
“You don’t want to believe your simulations too much, because nature is much harsher,” Moustakas said.
Bailey added, “We are currently bootstrapping off other experiments; then we’ll be bootstrapping off ourselves.”
Smith noted that to prepare for ever-larger surveys, there will be a need for more detailed and accurate models to home in on the nature of dark energy and gravity, for example.
“To be able to make cosmological measurements at the required high precision to be able to tell all of these viable models apart, it’s really important to have more and more realistic mock catalogs,” he said.
NERSC is a DOE Office of Science User Facility.
About NERSC and Berkeley Lab
The National Energy Research Scientific Computing Center (NERSC) is a U.S. Department of Energy Office of Science User Facility that serves as the primary high performance computing center for scientific research sponsored by the Office of Science. Located at Lawrence Berkeley National Laboratory, NERSC serves almost 10,000 scientists at national laboratories and universities researching a wide range of problems in climate, fusion energy, materials science, physics, chemistry, computational biology, and other disciplines. Berkeley Lab is a DOE national laboratory located in Berkeley, California. It conducts unclassified scientific research and is managed by the University of California for the U.S. Department of Energy. »Learn more about computing sciences at Berkeley Lab.