


NERSC’s Spinning Cube of Doom Takes a Turn in the Spotlight
June 1, 2004
When Stephen Lau of NERSC’s networking and security created a graphical display to highlight the many malicious scans and threats lurking in cyberspace, he christened it the “Spinning Cube of Potential Doom.” Developed to increase awareness of the level of malicious traffic on the Internet, the Cube is a visual display of network traffic collected using the Bro Intrusion Detection System developed by LBNL’s Vern Paxson. Bro monitors network links, searching for traffic that potentially violates a site’s access and usage policies.
“Although there are many tools available for displaying network traffic and potential security incidents, the vast majority of these tools are developed by network and security professionals for network and security professionals,” Lau writes in the Perspective column of the June 2004 issue of Communications of the ACM. “The Cube attempts to display the overall level of malicious traffic in a fashion that can be easily understood by those without a computer security or networking background.”
And it works. The Cube debuted at the SC2003 conference in Phoenix and the large display attracted a steady audience of onlookers. Many of those pausing to watch seemed surprised at the level of malicious traffic on the Internet.
Here’s a description of the Cube’s data display from Lau’s column, which also rated a mention on slashdot.org.
“The Cube leverages Bro’s capability to log all instances of completed and attempted TCP connections, displaying this information within a three-dimensional cube. Each axis represents a different component of a TCP connection. The 'X' axis represents the local IP address space. The 'Z' axis represents the global IP addresses space. The 'Y' axis represents the port number. Port numbers are used in connections to locate services and coordinate communication (i.e. 22 for ssh and 80 for http).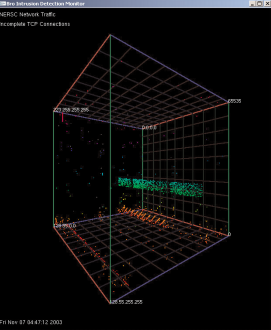
“TCP connections, both attempted and successful, are displayed as single points for each connection. The successful connections (SYN/FIN) are shown as white dots. Incomplete TCP connections are displayed as colored dots. Incomplete connections are either attempts to communicate with nonexistent systems or systems that are not listening on that particular port number, i.e. SYN/RST or SYN with no response. The incomplete connections are colored using a rainbow colormap with the color varying by port number. This color mapping was used to assist the viewer in locating the point in 3-space.
“The vast majority of colored dots can be considered to be malicious traffic searching for potentially vulnerable systems. A high number of connection attempts can be seen at the low end of the port range (0-1024), representing attempts to locate enabled well-known services (i.e. http, ssh, etc). Although some of these attempted connections can be explained by misconfigured applications or hosts that have inadvertently crashed and are no longer listening for connections, the patterns that emerge from the data shows that these ‘false positives’ are most likely in the minority."
For more information, contact SLau@lbl.gov.
About NERSC and Berkeley Lab
The National Energy Research Scientific Computing Center (NERSC) is a U.S. Department of Energy Office of Science User Facility that serves as the primary high performance computing center for scientific research sponsored by the Office of Science. Located at Lawrence Berkeley National Laboratory, NERSC serves almost 10,000 scientists at national laboratories and universities researching a wide range of problems in climate, fusion energy, materials science, physics, chemistry, computational biology, and other disciplines. Berkeley Lab is a DOE national laboratory located in Berkeley, California. It conducts unclassified scientific research and is managed by the University of California for the U.S. Department of Energy. »Learn more about computing sciences at Berkeley Lab.