


2019 User Survey Results
Methodology
NERSC conducts an annual user survey to collect feedback on the quality of its services and computational resources. The user survey was first conducted in 1998 and had significant revisions in 1999 and 2018. For 2019 we outsourced the surveying to the National Business Research Institute (NBRI), a global research and consulting organization with expertise in customer surveys.
NERSC aims to receive survey responses from 10% of active users and representing 50% of the NERSC Hour usage, to ensure that users who most closely interact with NERSC systems and services are sufficiently represented and that the survey responses reflect the impact of NERSC operations.
The 2019 User Survey ran from February 7, 2020 to March 5, 2020. The survey was sent to 6,792 active users and received responses from 12% of them, representing 50% of the total charged hours in 2019.
| Survey sent to 6,792 active users | 2018 Target | 2018 Actual | 2019 Target | 2019 Actual |
| Total # of responses | 696 | 577 | 679 | 824 |
| % of all active users responding | 10% | 8.3% | 10% | 12.1% |
| % of NERSC-Hours represented by survey respondents | 50% | 56.6% | 50% | 51.5% |
Table 1. 2019 NERSC user survey response rate.
Survey Design and Methods
On advice from NBRI, the 2019 survey used a 6-point scale in place of the previous 7-point scale; "1" represents "very dissatisfied" and "6" represents "very satisfied." The 6-point scale forces respondents to choose a non-neutral response and is expected to give better data for this and future surveys, but it means that survey results from 2019 do not map one-to-one to the results from earlier years, for two reasons:
- Comparing 2019 results with 2018 results requires us to scale the scores for one year;
- Previously neutral responses are now shifted into a decisive category, which might alter the distribution.
From a user-experience perspective, the survey questions have changed from looking like Figure 1a to looking like Figure 1b.
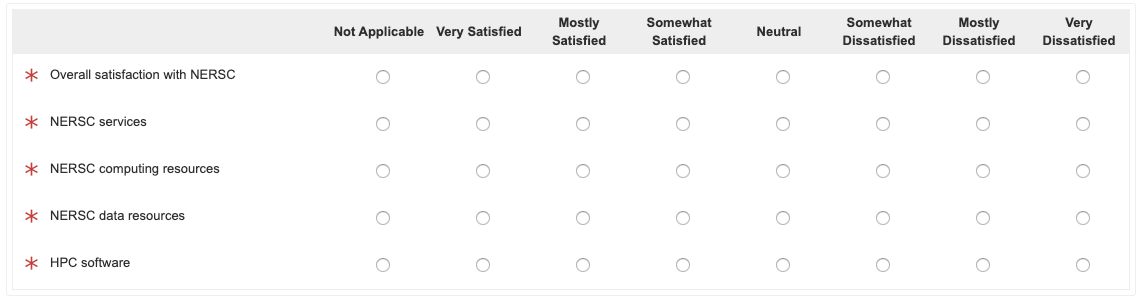
Figure 1a. A sample of the 2018 survey.
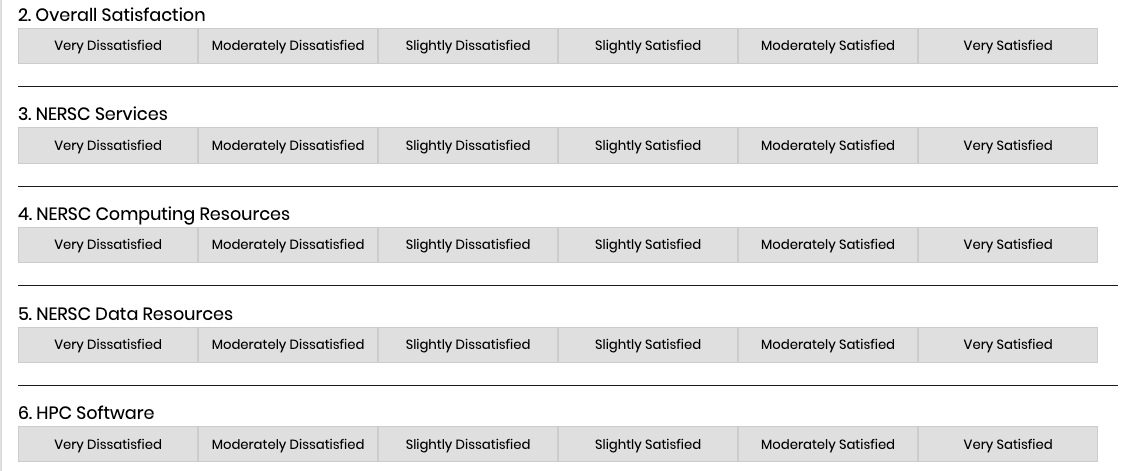
Figure 1b. A sample of the 2019 survey.
In the 2018 OA, we detected a number of survey respondents whose scores contradicted their free-form comments. With the updated question format, this issue has been eliminated. Conversely, a small number of survey respondents commented that they would like to have a "Neutral" or "Not Applicable" option.
Survey Results
The overall satisfaction scores for 2019 are shown in Table 2.
| Survey Area | 2018 Target | 2018 Actual | 2019 Target | 2019 Actual | 2019 Scaled for Comparison(*) |
| Overall Satisfaction | 5.25/7 | 6.22/7 | 4.5/6 | 5.29/6 | 6.22/7 |
| Services Overall | 5.25/7 | 6.36/7 | 4.5/6 | 5.45/6 | 6.40/7 |
Table 2. Overall satisfaction ratings. The final column shows the 2019 scores scaled to a 7-point scale as explained in the text.
Since we moved from a 7-point scale to a 6-point scale, we had to normalize the scores if we wanted to compare year over year. On the 2019 survey, the middle “Neutral” option (corresponding to 4 in the 2018 survey) was eliminated, forcing users to choose between the choices corresponding to scores 3 and 4 on the 2019 survey. For comparing the change from 2018 to 2019, we scaled the 2019 results to the 2018 scale by assigning the values associated with each 2019 rating as shown in the third row of Table 3. This results in the same scores as if the 2019 survey had the same choices as in 2018, except that as if users were unable to select “Neutral,” forcing them to choose one of the ratings on either side.
| Very Dissatisfied | Moderately / Mostly Dissatisfied | Slightly / Somewhat Dissatisfied | Neutral | Slightly/ Somewhat Satisfied | Moderately / Mostly Satisfied | Very Satisfied | |
| 2018 | 1 | 2 | 3 | 4 | 5 | 6 | 7 |
| 2019 | 1 | 2 | 3 | N/A | 4 | 5 | 6 |
| 2019 Normalized for Comparison to 2018 | 1 | 2 | 3 | N/A | 5 | 6 | 7 |
Table 3. Values assigned to each satisfaction score response for calculating average scores on the NERSC 2018 and 2019 user surveys. NERSC removed the “Neutral” option for 2019. The wording of the selections was slightly different in four categories, as shown by the headings in each column (2019 phrasing / 2018 phrasing).
The scaled average overall satisfaction scores seen in Table 2 are equal to or higher than those in 2018. Historically, the average score for overall satisfaction is between "moderately" and "very" satisfied, and this is the case for 2019. Figure 2 shows the overall satisfaction over time, using the 7-point scale.
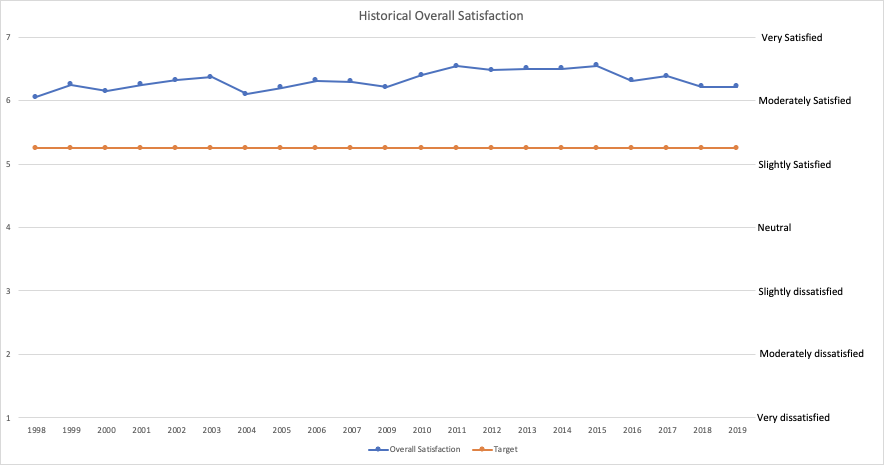
Figure 2. Overall satisfaction metric over time since the survey was started, on the 7-point scale.
The average satisfaction scores in each category remained well above the minimum satisfaction target, as shown in Figure 3. Figure 4 shows the distribution of scores for each metric.
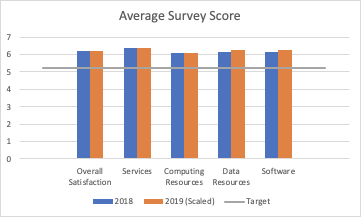
Figure 3. Average satisfaction scores on 7-point scale.
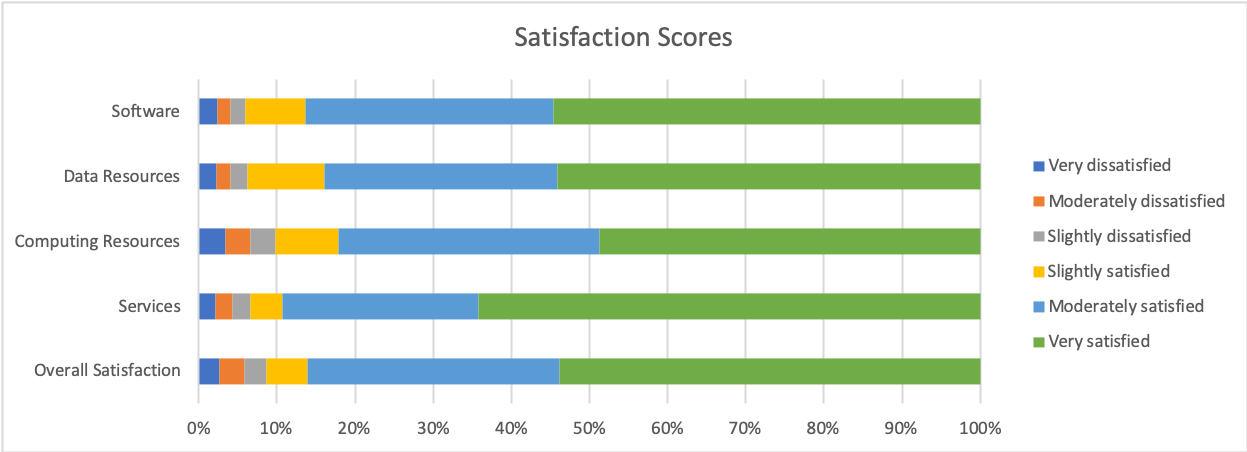
Figure 4. Percentage of survey respondents by satisfaction level.
Factors Affecting Satisfaction
The distribution of satisfaction scores shown in Figure 4 indicate that users rate NERSC highly in all of the overall satisfaction categories. More than half of the responses were "very satisfied" in all categories except Computing Resources, for which “very satisfied” responses made up slightly under 50%. In all categories, more than 80% of respondents gave NERSC one of the top two satisfaction scores.
For a finer-resolution understanding of the factors impacting satisfaction, the survey solicits free-form comments about what NERSC does well and could do better. Users especially like NERSC's consulting and user support, its provision of large-scale resources, and its extensive documentation. Provided software, user training, and communication with users were also frequently praised.
Understanding and Addressing Dissatisfaction in Users
The most frequent complaint from users is, by far, the long job queue time, followed by the system outages. Some of these comments concerned exceptional events such as the Public Safety Power Shutoffs that affected NERSC in October, but users considered even scheduled downtime for monthly maintenance or for facility power upgrades inconvenient.
Key areas of dissatisfaction in 2018 were:
- Queue wait times
- Storage space limits
- Requirement to use MFA
- Compute time/allocation limits
- System stability and uptime
Below we discuss each one and our plans to address it.
Queue Wait Times
Queue wait times are a perennial challenge at HPC facilities, but we continue to take steps to address wait times on our systems for NERSC users. As usage from experimental and observational facilities continues to grow at NERSC, and the need for near real-time computing, deadline-driven computing and dynamic reservations increases, NERSC must find ways to mitigate long wait times.
A number of factors determine wait times: the overall number of allocated hours on the systems, the charge factors and discounts on various systems, how users distribute their usage over time and across systems, and allocation reductions and additions of time by DOE program managers throughout the year.
In 2019, queue wait times again were extremely long at the end of the year. We note that managing and balancing queue wait times requires constant monitoring and adjustment of policies. We are taking a number of steps to reduce queue wait times, and it appears to be having an effect in early 2020:
- In 2018 and 2019 we noticed that the queue wait times were longer on Cori-Haswell than on Cori-KNL. To help the broad user base transition to KNL, we held six sessions of KNL office hours in 2019, leading more users to transition to Cori-KNL.
- In early 2020 the charge factors on Cori-KNL and Cori-Haswell were adjusted to reflect the retirement of the Edison system and new distributions of node types.
- We have increased the utilization of the system through improved scheduling with Slurm. The ability to schedule jobs more efficiently means more jobs are running on the system and fewer are waiting.
- For 2020 we are discussing with DOE allocation managers a trial year where we do not take back time from projects that do not use it (allocation reductions) two times per year. There are a few reasons for trying this. We hypothesize that the time re-allocated to projects from allocation reductions leads to end-of-year long wait times. In addition, users dislike allocation reductions. Instead, we propose allowing users and projects that run out of time to run in an “over-run” mode such that their projects have low priority but may still run if the system has spare cycles. NERSC would monitor the over-run usage carefully.
Storage Space Limits
A project’s storage space was quite limited in 2018 and 2019 as NERSC was in the process of deploying the Community File System. The number of users citing storage space limits as a source of dissatisfaction is significantly lower for 2019, possibly due to the fact that users filled out the survey as NERSC's new Community File System was deployed in January 2020, providing users an increase in storage capacity. We expect fewer storage space limits issues in 2020 as the Community File System deployment has increased users' storage capability significantly.
Requirement to use MFA
User dissatisfaction with the requirement to use MFA was greatly reduced in 2019. In fact, the relative ease-of-use of NERSC's MFA implementation was frequently cited as something NERSC does well.
Compute time/allocation limits
Compute and allocations limitations are real and were felt strongly by users in 2019 as Edison retired half-way through the year. A large increase in allocations will be delivered to users in 2021 with early-access time on the Perlmutter system for a significant fraction of users.
System Downtimes
The number of total outages on Cori was about the same in 2018 and 2019 (31 and 32, respectively), and the number of unscheduled outages decreased from 21 to 19. Some of the outages were longer in 2019, however, and the retirement of Edison in May 2019 likely also was felt by users as there was no longer a second system to use during Cori outages.
In addition to initiatives to increase operational resilience, NERSC is working to improve user workflow resilience via variable-time jobs and checkpoint-restart.
Causes of Dissatisfaction in 2019
In 2019, a number of the same themes emerged, with queue wait times and system downtimes as the top areas of users' concerns.
No other single factor was significant in the comments of dissatisfied users. NERSC documentation received strongly positive comments and features as a key contributor to user satisfaction, but a number of users also requested additional documentation on certain topics and improvements to the navigability of documentation. This suggests that extensive, quality documentation is highly valued by users and a good target for further NERSC effort.
User Comments
The three free-form questions in the user survey gave users a chance to comment on issues important to them. Users are asked “What can NERSC do to serve you better?”, “What does NERSC do well?” and “Is there any other issue on which you would like to comment?”
What does NERSC do well?
There were 409 responses to the question “What does NERSC do well?” There were a few broad categories that users called out the most:
- Consulting and account support, training, ERCAP allocation process
- Provides stable, highly available and easy to use HPC resources
- Center is run very well overall
- Documentation
- Software, with Jupyter mentioned often
- Communication with users, including online status information
Sample user comments:
- Excellent user support and response times. Highly knowledgeable technical support staff that can solve problems.
- The documentation and technical support is exceptional.
- I like your weekly emails, just about the right amount of content.
- Ease of use, especially with Jupyter hub, makes NERSC the best HPC center I've used.
What can NERSC do to serve you better?
This question elicited 240 responses. The most common were related to:
- Provide more allocation and shorter queue waits
- Improve documentation
- Improve system reliability and availability; fewer downtimes
- Different processors: more of traditional CPUs and/or GPUs
Sample user comments:
- The only issue I think we encountered with NERSC was that key resources seemed to go down for routine maint[enance] and sometimes other reasons for long enough that it impacted our project productivity a little too often.
- My only issue with NERSC is that the queue times can be very long. Jobs in the regular queue can take several days to a week to start on Cori KNL and over a week to start on Cori Haswell. I realize there's probably not a lot that can be done to help with this problem besides reducing allocations, and all else being equal it's much better to have longer queue times than smaller allocations and fewer users.
- Make documentation better available online.
- Not really sure where the documentation for stuff lives - i.e. how to submit a job to the cluster, etc.
- As a non-"power user," I think it would be helpful to have a bit more clear documentation on how to set up relatively "simple" jobs.
Is there any other issue on which you would like to comment?
Comments in this section largely reflected those in the previous two, with a potpourri of additional comments on individual topics. However, one comment did seem to touch on the fact that documentation was often listed as both something NERSC does well and also as something to improve upon:
- NERSC documentation is extensive (very nice to have) but often difficult to find. I find myself usually looking for resources though Google searches and finding outdated material.