


OpenMSI: A Science Gateway to Sort Through Bio-Imaging’s Big Datasets
August 27, 2013
By Linda Vu
Contact: cscomms@lbl.gov
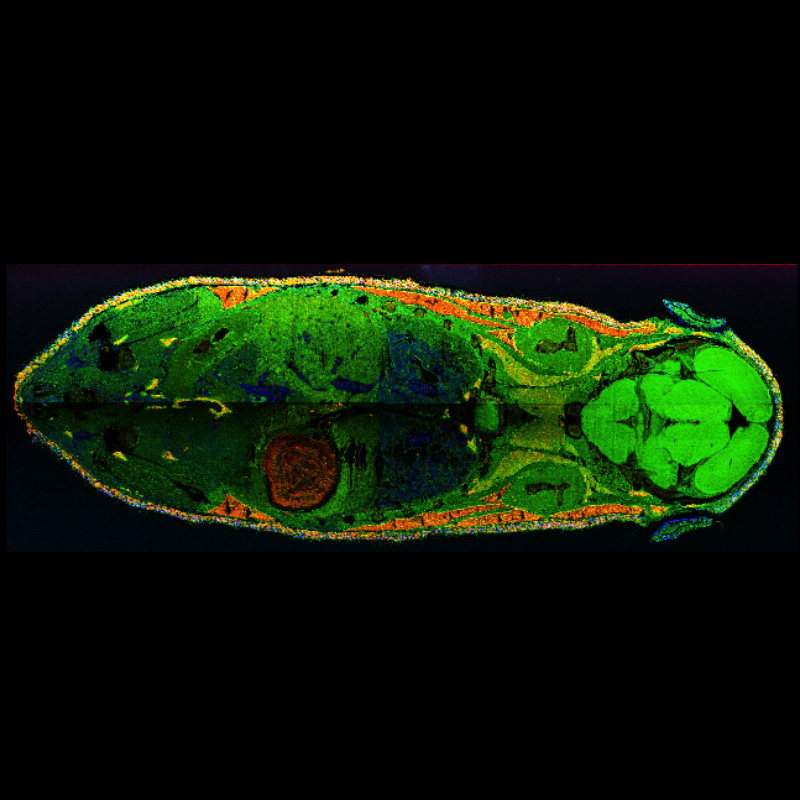
This overlay of mass spectrometry images shows the spatial distribution of three different kind of lipids across a whole mouse cross-section. Lipids act as the structural components of cell membranes and are responsible for energy storage, among other things. Image credit: Wolfgang Reindl (Berkeley Lab).
Using cutting-edge mass spectrometry imaging (MSI) technology, scientists can study tissues, cell cultures and bacterial colonies in unprecedented detail at the molecular level. This information is already helping doctors better diagnose diseases, pharmaceutical researchers develop more effective drugs, and leading to the creation of energy efficient and renewable biofuels.
Despite the advances, researchers envision these areas of science progressing much faster—if only they had a standard set of computational tools to easily process, analyze and share these massive datasets. Now, they do—it’s called OpenMSI.
“We’ve incorporated advanced computational tools into OpenMSI, which allow scientists to easily visualize, analyze, manage and share MSI data with other researchers, all over the world via the web,” says Oliver Ruebel, a computational scientist at the Lawrence Berkeley National Laboratory (Berkeley Lab).
This work is part of a larger effort at Berkeley Lab to extend advanced computational techniques to science areas (and scientists) that haven’t benefited from them in the past. OpenMSI was born from the Lab's Integrated Bioimaging Initiative, and is an interdisciplinary collaboration between biologists and computational researchers at Berkeley Lab and the National Energy Research Scientific Computing Center (NERSC).
Bio-Imaging’s Big (Data) Problem
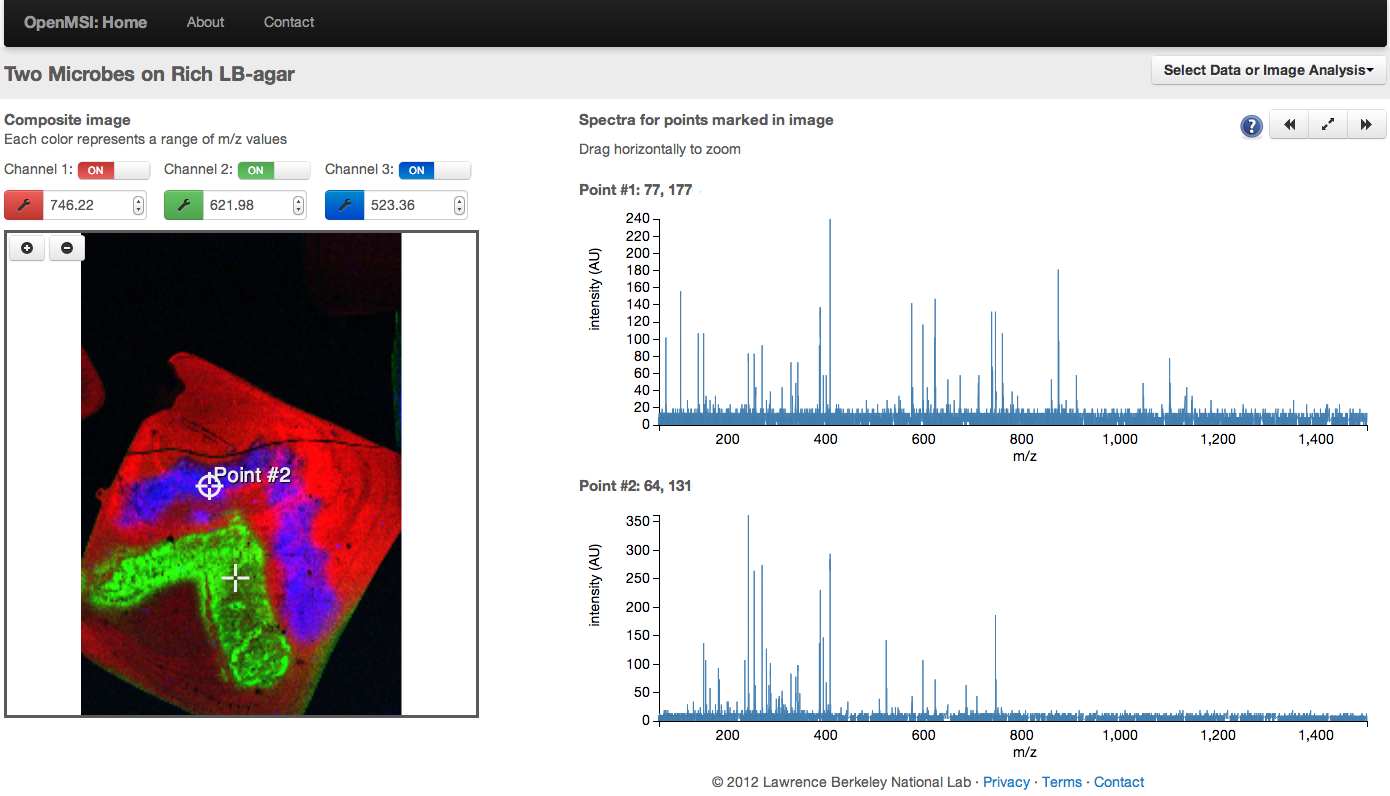
Screen-shot of the OpenMSI online data viewer. A mass spectrometry image is shown on the left. Each pixel in this image is literally packed with information. This information is displayed as a complex spectrum (shown on the right) where each peak indicates the presence of a molecule. As researchers click around the image, the spectrum changes to show the molecules packed within the selected pixel. Credit: Oliver Ruebel and Ben Bowen (Berkeley Lab)
“A typical MSI file ranges anywhere from 10 to 50 gigabytes—that’s equivalent to about 20,000 digital photos of your friends and family. Most users cannot even open these files; those who do then have to figure out how to sort through a vast amount of information,” says Ben Bowen, a scientist in Berkeley Lab’s Life Sciences Division.
So why are these MSI files so big? According to Bowen, it’s because each position (or pixel) is literally packed with information. This information can be displayed as a complex spectrum—a line graph of densely packed peaks and valleys—where each peak indicates the presence of a molecule.
“The peak could be coming from small molecules like lipids or larger molecules like proteins,” says Bowen. “If you record a million positions in your sample, you now have a file that’s as big as your computer’s hard drive. This is a huge challenge because now you have to figure out which peaks to investigate and how you’re going to share this information with collaborators.”
Over the past decade, Bowen and his colleagues in Berkeley Lab’s Life Sciences Division received funding from various sources, including Department of Energy programs like ENIGMA and the Low Dose Scientific Focus Area, to develop algorithms for analyzing massive MSI datasets.
“In our group, Ben (Bowen) used MATLAB to build these analysis tools, but few of our collaborators knew the code well enough to use it. This eventually became a bottleneck, where some of our collaborators had to sit with Ben for days or weeks to turn their raw MSI data into useful information,” says Trent Northen, also a scientist in Berkeley Lab’s Life Sciences Division.
To eliminate this bottleneck, Bowen teamed up with Ruebel to incorporate some of his algorithms and other advanced computational analysis tools into a NERSC Science Gateway called OpenMSI. This gateway leverages NERSC’s supercomputing resources to process, analyze, store, and serve massive MSI datasets to users via a web browser. With this tool, researchers can interact with the MSI datasets over the Internet, in real time, without downloading anything. The team also designed a user-friendly graphical user interface for the science gateway, so that even researchers without any programming skills can easily access and analyze the data.
“Our goal with OpenMSI was to automate the analysis of MSI data and make it scalable, so that researchers would not have to rely on a computationally savvy person—like Ben—to help them open, visualize and analyze their data,” says Ruebel.
From Ad Hoc to a Community Standard
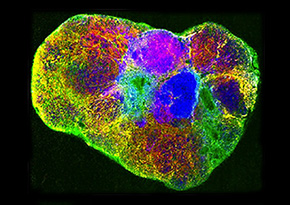
This overlay of mass spectrometry images shows the synthesis of new lipids and their distribution of in a tumor. The different lipids are represented in various colors. Image Credit: Katherine Louie (Berkeley Lab).
“Before OpenMSI, many research groups developed their MSI analysis software in-house and there was no way to effectively share data with the community,” says Northen.
So in developing OpenMSI, Ruebel (a computational scientist) worked closely with Bowen (a research scientist who uses MSI) to develop a standard system for organizing, tagging and storing, both raw and processed MSI data. They also developed a tool for retrieving this data over the web, and worked with NERSC engineer Shreyas Cholia to set it up on the facility’s Science Gateway hardware.
To make accessing, analyzing, storing and sharing the data easier, the duo also teamed up with NERSC engineer Annette Greiner to create an interface that visualizes an MSI sample and its corresponding spectrum, side by side, in a single web browser. This allows users to interact with the data by pointing to a position in the image and see the spectrum peak that it corresponds to, and vice versa. They can also share this data with collaborators simply by sharing a link, so no files have to be downloaded—all of the computer processing and storage occurs on NERSC systems.
According to Ruebel, the biggest hurdles to building OpenMSI were that the existing MSI file formats were inefficient for analyzing, managing, retrieving and storing data. He notes that it would take several minutes just to retrieve an image of a single molecule from a large MSI dataset using existing MSI file formats. And because different groups developed their own customized file formats, researchers in the community could not easily share their data.
To address this, Ruebel developed a new data format for storing MSI data based on the popular HDF5 library. This software library runs on a range of computational platforms, from laptops to massively parallel supercomputers, and contains a set of performance features that allows researchers to easily access, manage and store their data.
Ruebel managed to tune a number of the performance features to significantly reduce the storage requirements of even the most massive MSI datasets, and allow researchers to retrieve their data 2000 times faster than before.
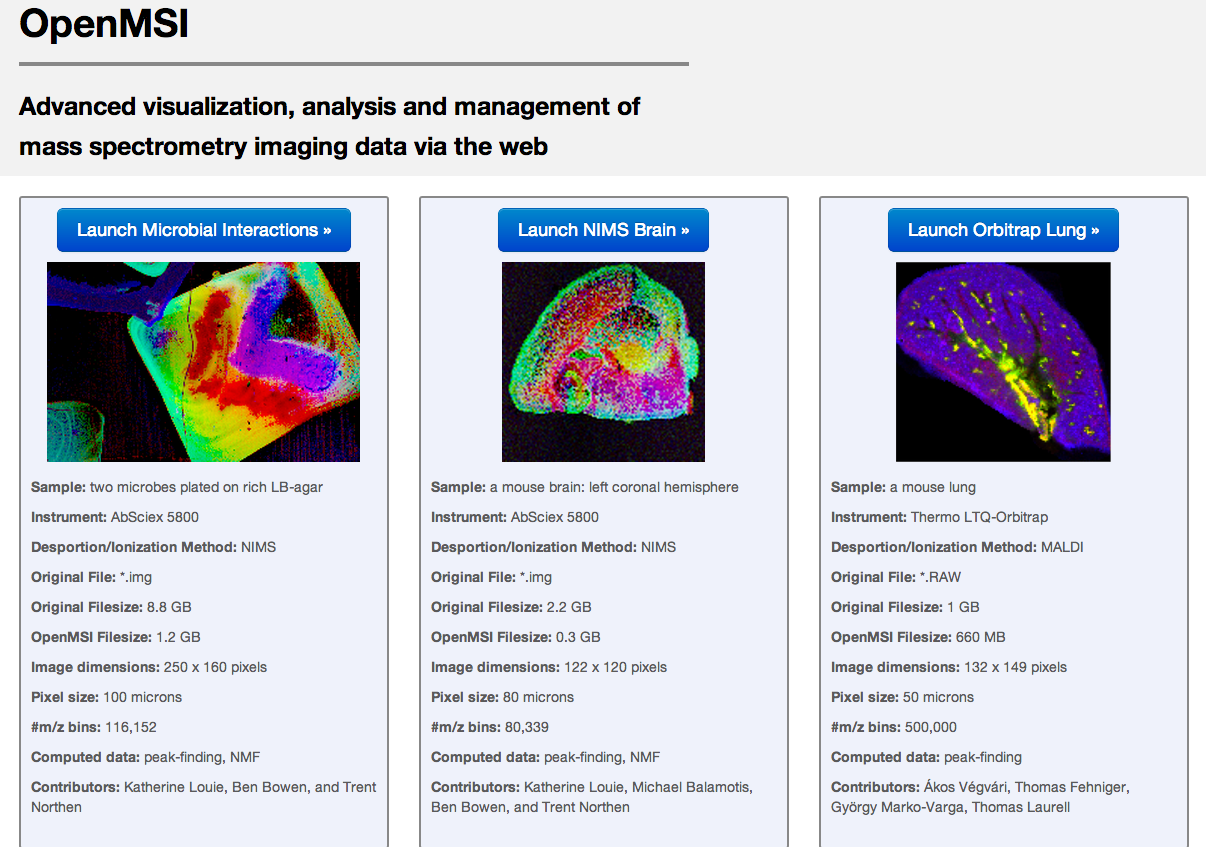
Screen-shot of the OpenMSI Science Gatewayhttps://openmsi.nersc.gov/openmsi/client/
“With this new format, researchers can retrieve data from even the largest MSI datasets—including images and spectra—at unprecedented speeds of less than 0.3 seconds,” says Ruebel. “This achievement just goes to show the benefit of working closely with application scientists to identify common data access patterns and data needs.”
“Working with professional computer scientists like Oliver, Annette and Shreyas was a real game changer,” says Bowen. “Despite my extensive programming experience, I would really have to explore the territory to build a tool like OpenMSI by myself, but the professional computer scientists used the best tools and created an abstract representation of test cases and practices really quickly.”
“We were fighting our data like everyone else in mass spectrometry imaging. We built our own software to analyze our data and publish our papers,” says Northen. “By virtue of Oliver and Ben’s collaboration, they were able to take a one-lab solution and generate something that is universally accessible and useful. This will be really transformative for mass spectrometry imaging as a whole because the data analysis has been such a huge roadblock.”
“As scientific instruments and experiments grow more sophisticated and data intensive, more scientists need similarly sophisticated computational tools and techniques,” says Kathy Yelick, associate lab director for computing sciences at Berkeley Lab. "We're committed to bringing mathematical and computational techniques to bear on these previously unexplored science problems."
More Information:
OpenMSI was recently highlighted in Science Magazine (Vol. 30, No. 6136, Published May 31, 2013).
About NERSC and Berkeley Lab
The National Energy Research Scientific Computing Center (NERSC) is a U.S. Department of Energy Office of Science User Facility that serves as the primary high performance computing center for scientific research sponsored by the Office of Science. Located at Lawrence Berkeley National Laboratory, NERSC serves almost 10,000 scientists at national laboratories and universities researching a wide range of problems in climate, fusion energy, materials science, physics, chemistry, computational biology, and other disciplines. Berkeley Lab is a DOE national laboratory located in Berkeley, California. It conducts unclassified scientific research and is managed by the University of California for the U.S. Department of Energy. »Learn more about computing sciences at Berkeley Lab.