


Data Competition
Data Competition
The data competition will be held on the morning of Wednesday, September 20 (9 am - noon), during the NERSC Data Day and NUG 2017.
Participants can pick from one of the two available data analysis challenges: NERSC Job Analysis or Astronomy Catalogs. Participants could start to work on the challenge problems from two weeks before the actual data competition day on Wednesday, September 20, when each participant is given up to 5 minutes to present a few slides about your analysis technologies and results. A winner per challenge will be picked by the NERSC Data Competition Committee based on the following criteria:
- How well do you use NERSC Data Analytics Tools Stack? (You are encouraged to explore tools described at https://www.nersc.gov/users/data-analytics/data-analytics-2)
- What is the scalability time to solution of the analysis method?
- What is the accuracy of the analysis method?
- What is the quality of visualization?
Please contact Helen He (yhe@lbl.gov) or Debbie Bard (djbard@lbl.gov) to indicate the interest to participate the data competition, and we will add you to a Slack channel for further communications and answer any questions you may have.
Data Challenge #1: NERSC Job Analysis
Archived running jobs information provides us abundant opportunities to analyze running jobs patterns, system utilization, batch scheduler characteristics, job submission strategies, and more.
For this challenge, users are given the historical Slurm jobs information on Cori and Edison from 1/1/2016 to 8/31/2017, stored in the CSV format. You are free to analyze both Cori and Edison, or just one system. The data sets and a brief README file are available at /global/project/projectdirs/mpccc/data_competition .
You are free to work on any one or more of the following open questions using Data Analytics and Machine Learning tools or to come up with your own creative questions and answers!
- Baseline running jobs statistics (impressive visualizations are encouraged!)
- What are the best times of day and week to submit a job? (define and tell us your favorite size of particular interest)
- What are the best size and length of jobs to submit? Is it better to bundle small jobs to a large job or to submit many small jobs?
- How often do users overestimate wall time requests?
- Is there a single job characteristic that minimizes queue wait time?
FYI. Some of the NERSC Jobs analysis results are available at:
- Queues: https://my.nersc.gov/queues.php?machine=cori&full_name=Cori
- Completed Jobs: https://my.nersc.gov/completedjobs.php
- Job Size Chart: https://my.nersc.gov/jobsize.php
- Queue Backlog: https://my.nersc.gov/backlog.php
- Queue Wait Times: http://www.nersc.gov/users/computational-systems/queues/queue-wait-times/
- Job Completion: https://my.nersc.gov/jobcompletion.php
Please contact yhe@lbl.gov (Helen He) to indicate the interest to work on this challenge and for any questions.
Data Challenge #2: Astronomy Catalogs
This is a galaxy: This is a star: But what is this?

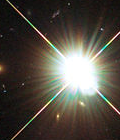

Astronomical images provide some of the richest (and most beautiful!) image data available to scientists. But identifying what we’re looking at in these images poses a real challenge for astronomers. Distant galaxies and faint stars both appear in these images as a handful of bright pixels against a noisy background, and astronomers have spent decades developing methods to distinguish between them. The best methods rely on measures of object size, shape and color. In this challenge, we supply a catalog of measurements made by the Sloan Digital Sky Survey from over 1 million astronomical objects observed over the ten-year telescope survey, and we ask you to develop a method to distinguish between stars and galaxies (and other object types) using a machine learning method.
For more background, please see the description of this (private) Kaggle competition:
https://inclass.kaggle.com/c/galaxy-star-separation
A “test” dataset will be provided on the day - your classifier will be evaluated on this testing set. Note that we are interested in how well optimised your *training* code performs, not your classifier! Think about how to visualize your results - which variables are more important? Can you show a ROC curve?
You can download the csv file of the data here (updated Sept 15th. Note that the previous version of this training data did not have quasars classified separately, but were included in the "other" category. If you have been working with this older dataset, we will provide you with the appropriate evaluation dataset on the day). Each line is one object; the first line gives the names of the measurements associated with each object. The last variable on each line is the "truth" - this is the class of the object, based on spectroscopic data. The first variable ("type") is the estimate of this class from the simple SDSS classifier. See if you can do better than this classifier!
The objects types are defined as follows:
- 1: Star
- 2: Galaxy
- 3: Quasar
- 0: Other
Variable Name |
Description |
| type | Output from SDSS classifier (note that this is NOT the "truth" variable, but rather a benchmark to compare your results to).: |
|
ra |
Right Ascension (coordinate: https://en.wikipedia.org/wiki/Equatorial_coordinate_system#Use_in_astronomy) |
| dec | Declination (coordinate: https://en.wikipedia.org/wiki/Equatorial_coordinate_system#Use_in_astronomy) |
|
psfMag_u, psfMagErr_u psfMag_g, psfMagErr_g psfMag_r, psfMagErr_r psfMag_i, psfMagErr_i psfMag_z, psfMagErr_z |
PSF magnitude and error in the 5 wavelength filter bands, u/g/r/i/z. http://skyserver.sdss.org/dr1/en/proj/advanced/color/sdssfilters.asp |
|
modelMag_u, modelMagErr_u modelMag_g, modelMagErr_g modelMag_r, modelMagErr_r modelMag_i, modelMagErr_i modelMag_z, modelMagErr_z |
Model magnitudes in the 5 filter bands: |
|
petroRad_g, pertroRadErr_g petroRad_r, pertroRadErr_r petroRad_i, pertroRadErr_i petroRad_z, pertroRadErr_z
|
Radius of object in the 5 filter bands: http://skyserver.sdss.org/dr1/en/help/docs/algorithm.asp?key=mag_petro |
|
q_u, qErr_u q_g, qErr_g q_r, qErr_r q_i, qErr_i q_z, qErr_z |
Stokes parameter q - a measure of ellipticity.
|
|
u_u, uErr_u u_g, uErr_g u_r, uErr_r u_i, uErr_i u_z, uErr_z |
Stokes parameter u - a measure of ellipticity.
|
|
mE1_u, mE1_g, mE1_r, mE1_i, mE1_z mE2_u, mE2_g, mE2_r, mE2_i, mE2_z |
Elipticity parameters mE1 and mE2 in each of the 5 filter bands: http://www.sdss.org/dr13/algorithms/classify/#photo_adaptive |
| class | ! TRUTH PARAMETER ! Spectroscopic class |
Evaluate your classifier using this dataset! (Note that if you used the "old" version of the training data you will want to use this dataset to evaluate your network) The columns are the same as the training dataset.
Data Competition Award Winners
Participants presented their analysis results and methods on the morning of September 20 during the Data Hackathon and Data Competition event. A panel of NERSC Data Competition judges selected the following winners:
Challenge #1: Juliette Ugirumurera and Liza Rebrova
Challenge #2: Yisha Sun and Grzegorz Muszynski

Left to Right: Jialin Liu, Helen He, Juliette Ugirumurera, Rebecca Hartman-Baker, Yisha Sun, Grzegorz Muszynski, Debbie Bard
Challenge-winning code
The winning code for the Astronomy challenge can be found in this github repository, belonging to Yisha Sun. The code uses TensorFlow to set up and train the network. The script tf_script_yisha.py sets up the TensorFlow model and carries out the training. Further analysis of the results was performed using the scripts confusion_matrix.py (to plot the confusion matrix), plot_features_importance.py (to determine the importance of each of the features used in the network) and roc_curve.py (to plot the ROC curve).
The winning code for the SLURM log data challenge can be found in this iPython notebook, which belongs to Juliette Ugirumurera. The code uses SciKitLearn to construct, train and evaluate the network.
For both of these challenges (as in most machine learning problems), note that a significant amount of work was required to clean the dataset and scale the variables of interest. These codes give a nice demonstration of how to do this for the two datasets provided for this challenge!