


Randomized Linear Algebra for BioImaging
Mass-Spectrometry Imaging
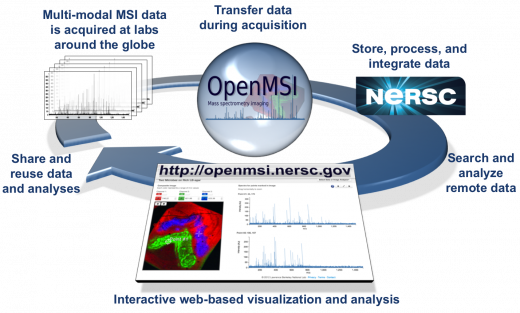
Mass spectrometry measures ions derived from the molecules present in a biological sample. Spectra of the ions are acquired at each location (pixel) of a sample, allowing for the collection of spatially resolved mass spectra. This mode of analysis is known as mass spectrometry imaging (MSI). The addition of ion-mobility separation (IMS) to MSI adds another dimension, drift time. The combination of IMS with MSI is finding increasing applications in the study of disease diagnostics, plant engineering, and microbial interactions. Unfortunately, the scale of MSI data and complexity of analysis presents a significant challenge to scientists: a single 2D image may be many gigabytes. Comparing multiple images is beyond the processing capabilities available to many scientists. The addition of IMS exacerbates these problems. Scientists around the globe are reliant on OpenMSI to process files and visualize their results over the web.
Datasets
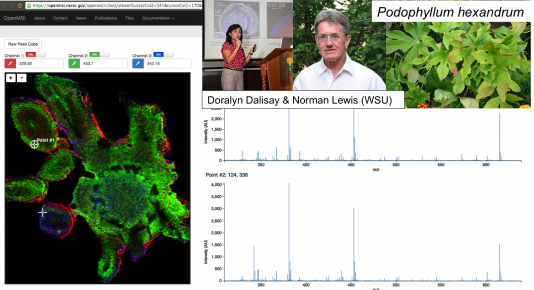
We analyze one of the largest (1TB sized) mass-spec imaging data sets in the field, obtained from a sample of the plant Peltatum from Lewis & Dalisay (below). The MSI measurements are formed into a sparse matrix whose rows and columns correspond to pixel and (τ , m/z) values of ions, respectively. Here τ denotes drift time and m/z is the mass-to-charge ratio. The sheer size of this data set has previously made complex analytics intractable. CX decompositions allow for the possibility of identifying small numbers of columns (ions) in the original data that reliably explain a large portion of the variation in the data. See below for more details about CX decompositions.
CX Decomposition
CX (and related CUR) decompositions are low-rank matrix decompositions that are expressed in terms of a small number of actual columns/rows, i.e, actual data elements, as opposed to eigencolumns/eigenrows obtained in principal component analysis (PCA). Given a matrix A with size m x n, to find a CX decomposition, we seek matrices C and X such that the approximation error ||A − CX|| is small and C is an m × k matrix comprising of k actual columns of A and X is a k × n matrix.
The construction of C follows the following two steps. First, compute the statistical leverage scores of the columns of A; and second, use those scores to select c columns from A. Once the matrix C is determined, the optimal matrix X can be found accordingly. Here, the statistical leverage scores can be interpreted as how much “leverage” or “influence” the j-th column of A exerts on the best rank-k approximation to A.
However, to compute the leverage scores exactly, typically one needs to compute the Singular Value Decomposition (SVD) of the given matrix A which may become very expensive when A is large. In order to reduce the complexity and make the algorithm more amenable to distributed computing environments, we use the recently developed randomized SVD techniques by Halko et al. to compute a set of approximate leverage scores for selecting columns.
Science Results
We implemented the CX decomposition algorithms in the Apache Spark environment and applied it to the analysis of 1TB sized mass-spec imaging data sets.
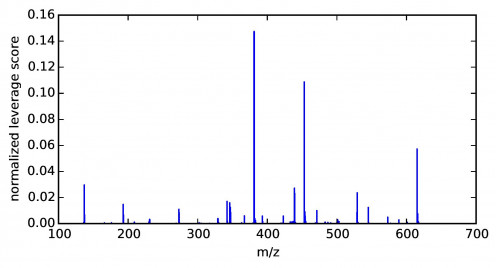
In the following figure, we present the distribution of the normalized ion leverage scores marginalized over τ . That is, each score corresponds to an ion with m/z value shown in the x-axis. Leverage scores of ions in three narrow regions have significantly larger magnitude than the rest. This indicates that these ions are more informative and should be kept in the reconstruction basis. Encouragingly, several other ions with significant leverage scores are chemically related to the ions with the highest leverage scores. For example, the ion with an m/z value of 453.0983 has the second highest leverage score among the CX results. Also identified as having significant leverage scores are ions at m/z values of 439.0819, 423.0832, and 471.1276, which correspond to neutral losses of CH2, CH2O, and a neutral “gain” of H2O from the 453.0983 ion. These relationships indicate that this set of ions, all identified by CX as having significant leverage scores, are chemically related. That fact indicates that these ions may share a common biological origin, despite having distinct spatial distributions in the plant tissue sample.
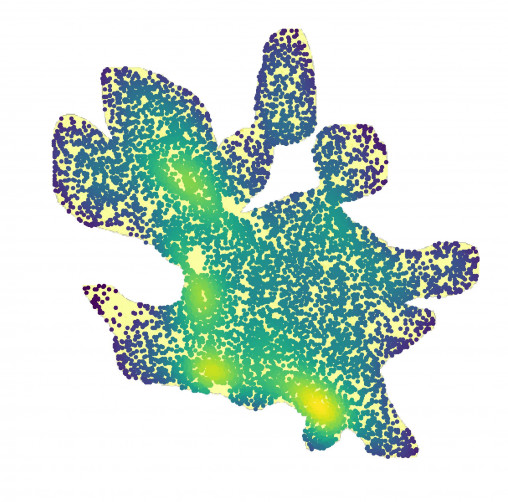
On the other hand, we observed that the pixel leverage scores are fairly uniform (not shown here). This is not surprising since similar pixels tend to have similar and small individual scores. Therefore, a random sample is still able to capture which larger-scale regions contain higher densities of important pixels, by sampling more pixels from the region as shown in the following figure.
References
-
D. S. Dalisay, K. W. Kim, C. Lee, H. Yang, O. Rübel, B. P. Bowen, L. B. Davin, and N. G. Lewis. "Secoisolariciresinol diglucoside formation and cyanogenic glucosides in flax seed: MALDI mass spectrometry imaging." Journal of natural products, 2015.
-
J. V. Marques, D. S. Dalisay, H. Yang, C. Lee, L. B. Davin, and N. G. Lewis. "A multi-omics strategy resolves the elusive nature of alkaloids in Podophyllum species." Molecular BioSystems 10, no. 11, 2838-2849, 2014.
-
J. Yang, O. Rübel, Prabhat, M. Mahoney, and B. P. Bowen. "Identifying Important Ions and Positions in Mass Spectrometry Imaging Data Using CUR Matrix Decompositions." Analytical Chemistry, 87(9), 4658-4666, 2015.
-
A. Gittens et al. "A Multi-platform Evaluation of the Randomized CX Low-rank Matrix Factorization in Spark." International Workshop on Parallel and Distributed Computing for Large Scale Machine Learning and Big Data Analytics (ParLearning), at IPDPS, 2016.
-
A. Gittens et al. "Matrix Factorization at Scale: a Comparison of Scientific Data Analytics in Spark and C+MPI Using Three Case Studies." arXiv:1607.01335 (preprint). July 2016.