


Special Feature: Supercomputers Map Our Changing Climate
September 23, 2013
Contact: Jon Bashor, jbashor@lbl.gov, 510-486-5849
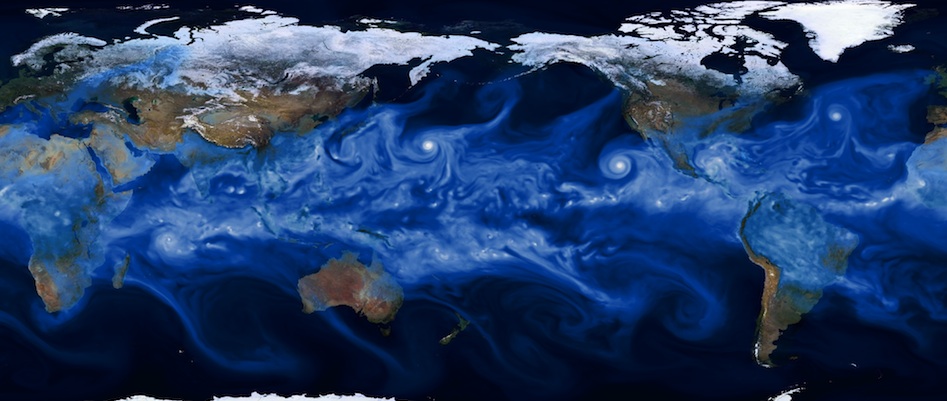
In this simulation, Berkeley researchers used the finite volume version of NCAR’s Community Atmosphere Model to see how well the model can reproduced observed tropical cyclone statistics. The simulated storms seen in this animation are generated spontaneously from the model’s simulated weather conditions long after the memory of initial conditions have been forgotten.
The study of climate is a very complex science and involves many factors, including sea temperature, currents, sea ice, the interaction between the surface of the ocean and the atmosphere, air temperatures over land and the role of clouds. Usually, a supercomputer application for studying climate involves an ensemble of applications modeling each of these components and having them all interact over a specified time, such as decades, centuries or even millennia. Running such models can require the simultaneous use of tens of thousands of processors running nonstop for weeks or months – a service that Department of Energy (DOE) supercomputing centers are well-equipped to provide.
At DOE’s National Energy Research Scientific Computing Center (NERSC) at Lawrence Berkeley National Laboratory (Berkeley Lab), 12 percent of the supercomputing resources – almost 150 million processor-hours – are used by researchers studying global climate change. As supercomputers grow increasingly powerful, they allow climate scientists to look at our planet in greater detail. In the late 1990s, for example, climate models treated the western United States from the Pacific Ocean to the Rocky Mountains as a uniform landmass without the mountains, deserts and waterways that affect climate. Thanks to increasingly powerful supercomputers and advances in algorithms and software, researchers today can model the globe in 10-kilometer squares. They expect to soon be at the 2-kilometer level. With each improvement in the resolution, the model is more accurate.
In honor of DOE's supercomputing month, here's a look at how researchers are using NERSC’s state-of-the-art supercomputers to learn about earth’s changing climate.
How Accurate Are Climate Models?
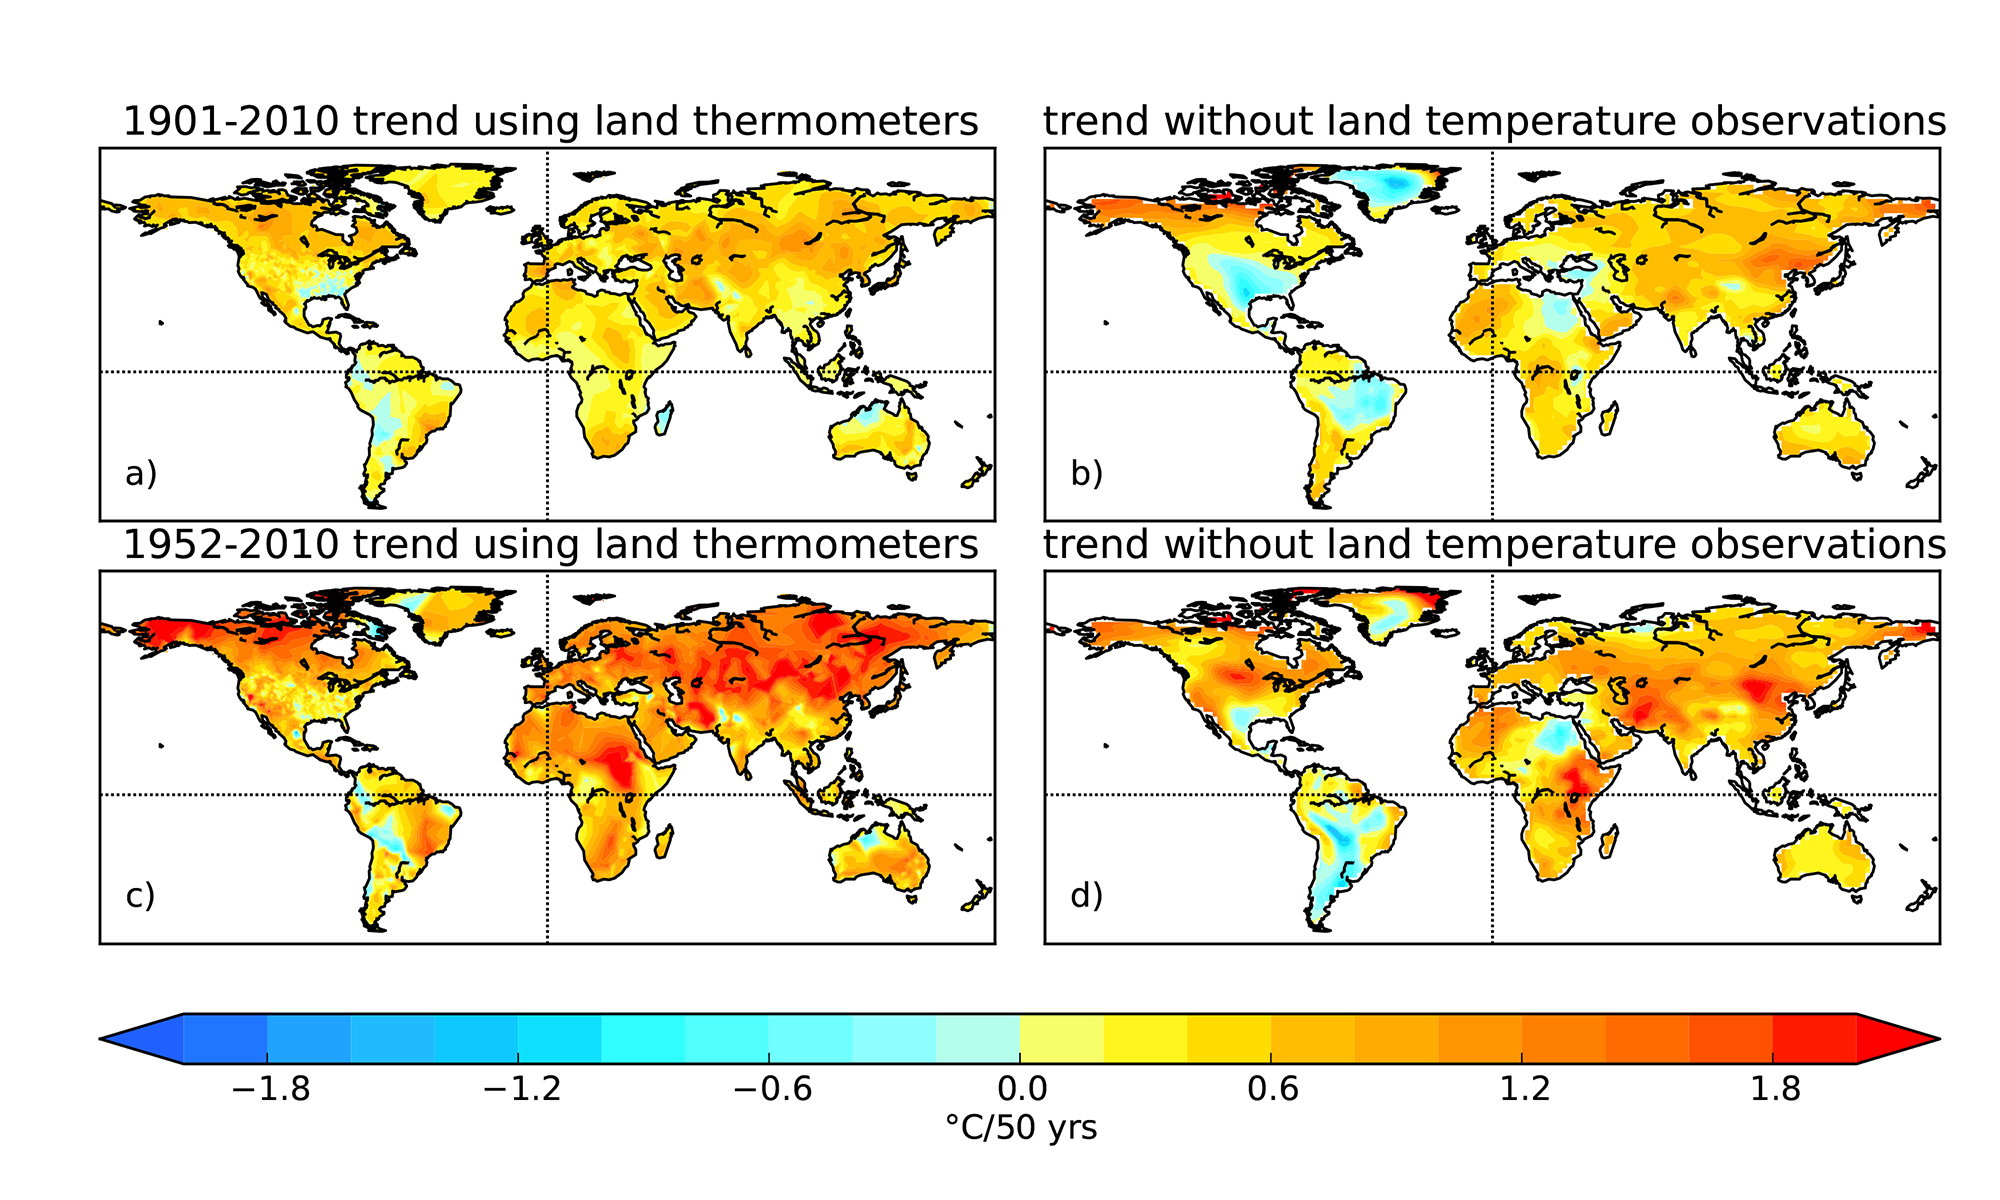
These maps show the changes in air temperatures over land as measured using thermometers (left side) and as calculated by the 20th Century Reanalysis project (left side). While more than 80 percent of the observed variation is captured by the computer model, the results show interesting differences in some regions such as the midwestern United States, Argentina and eastern Brazil. The differences may be due previously unrecognized issues with the pressure observations, variations in land use and land cover over time, issues with temperature measurements or some of the conditions set in the computational model.
One of the big questions about all supercomputer simulations is the accuracy of the result. For this reason, scientists closely compare their results with observations from experiments and check to see if the model results are within the realm of what’s observed or predicted based on past results.
In the case of climate research, one way to evaluate the accuracy of a model is to use it to “predict” the past. At NERSC, one of the main climate projects is the 20th Century Reanalysis Project led by Gil Compo of the University of Colorado, Boulder, and the National Oceanic and Atmospheric Administration’s (NOAA) Earth System Research Laboratory. Compo and his team collected all the information they could about the Earth’s climate over the past 140 years or so and plugged the data into applications to model the climate changes. This required getting information from newspaper weather reports, measurements on land at sea for the first decades, and then more detailed measurements from aircraft, satellites and other sensors in the second half of the 20th century and into the 21st century.
The result is something like a “climate time machine,” a comprehensive reanalysis of all global weather events from 1871 to the present day, from the earth's surface to the jet stream level. When the model was run, the results were striking. The model accurately predicted a number of extreme weather conditions, including El Niño occurrences, the 1922 Knickerbocker snowstorm that hit the Atlantic Coast (causing the roof of the Knickerbocker Theater in Washington, D.C., to collapse, killing 98 people and injuring 133), the 1930s Dust Bowl and a hurricane that smashed into New York City in 1938.
Read More:
http://www.nersc.gov/news-publications/news/science-news/2013/nersc-calculations-provide-independent-confirmation-of-global-land-warming-since-1901/
http://www.nersc.gov/news-publications/news/science-news/2011/climate-time-machine/
Clearing Up the Question of Clouds

A spherical geodesic grid (a) can be cut into logically rectangular panels (b), which offers a convenient way to organize the data in a computer’s memory. For visual clarity, this depiction shows a very low resolution grid.
Another project at NERSC aims to improve our understanding of the role of clouds in the global atmosphere. Clouds exert two competing effects on the Earth’s temperature: they cool the planet by reflecting solar radiation back to space, but they also warm the planet by trapping heat near the surface. These two effects coexist in a delicate balance.
In our current climate, clouds have an overall cooling effect on the Earth. But as global warming progresses, the cooling effect of clouds might be enhanced or weakened — global climate models are evenly divided on this issue. In fact, inter-model differences in cloud feedbacks are considered the principal reason why various models disagree on how much the average global temperature will increase in response to greenhouse gas emissions, when it will happen, and how it will affect specific regions.
David Randall, a professor of atmospheric science, is working to clear up that uncertainty by developing and testing a new kind of global climate model designed to take advantage of the extreme-scale computers expected in the near future.
“The GCRM [Global Cloud Resolving Model] is a computer model that simulates the motions of the atmosphere on scales from a single thunderstorm all the way up to the size of the entire earth,” Randall said. “It has about a billion little grid cells to represent the three-dimensional structure of the air.” Each of those billion cells has a wind speed, a temperature measurement, and a humidity level, among other factors. “So the number of numbers involved is in the tens of billions, just as a snapshot of what's going on at a given second,” said Randall. “No one has done this before in quite this manner, and it’s our hope that our project will point the way to future generations of models,”
Read More:
http://www.nersc.gov/news-publications/news/science-news/2010/bringing-clouds-into-focus/
Finding hurricanes in a sea of climate data
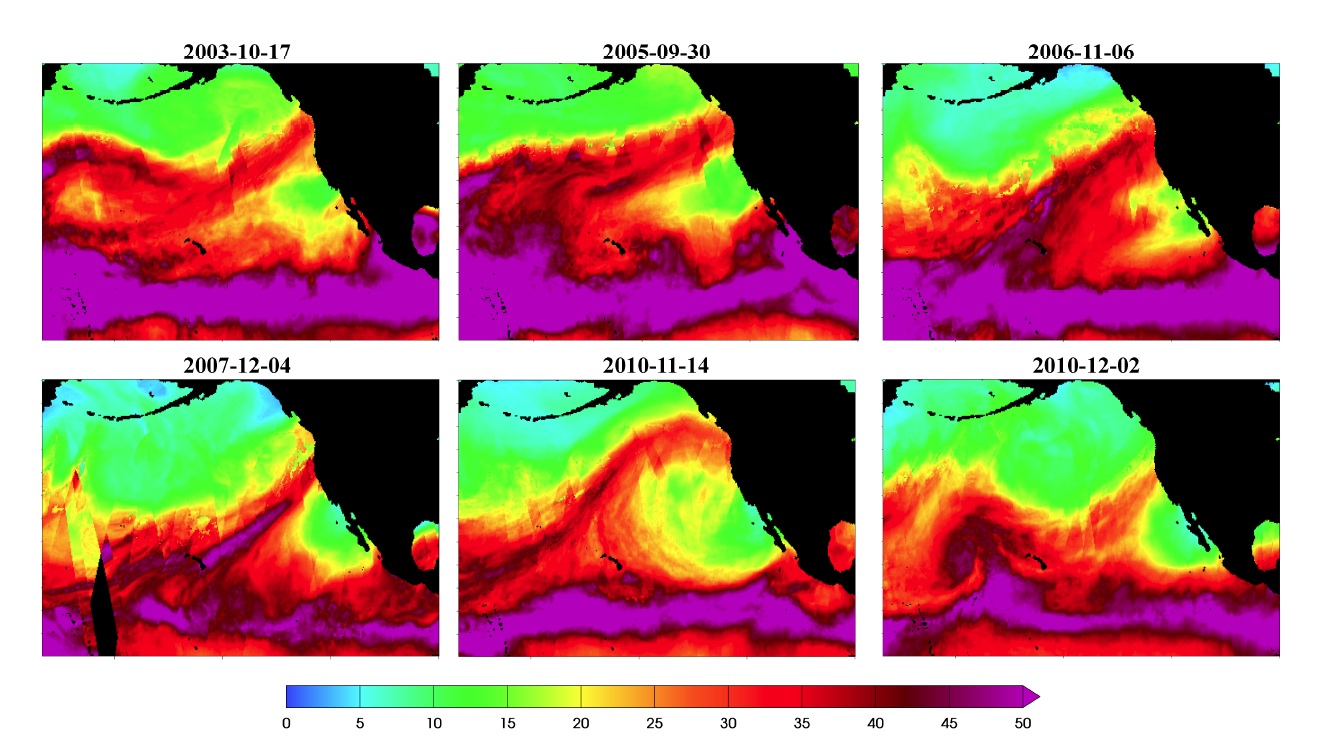
Some typical atmospheric river events detected by the new method from the observational dataset. Shown is total column integrated precipitable water in millimeters. Note that data irregularities in the satellite measurements (such as the abrupt discontinuities in the 2007-12-04 event) do not have an adverse effect on the detection procedure.
You’d think that spotting a category five hurricane would never be difficult. But when the hurricane is in a global climate model that spans several decades, it becomes a fleeting wisp among mountains of data. That’s a problem. As scientists develop ever more sophisticated computer models to predict the effects of climate change, one of the things they’ll look for are changes in the frequency of extreme weather events such as hurricanes and heavy precipitation. The more data generated by models, however, the more difficult it is to quantify these rare but potent events.
That’s why Berkeley Lab researchers are developing an automated way to quickly comb through a climate simulation’s huge dataset and tally the weather events that spell big trouble. “We’re using state-of-the-art methods in data mining and high performance computing to locate and quantify extreme weather phenomena in the very large datasets generated by today’s climate models,” says Prabhat, a scientific visualization expert in Berkeley Lab’s Computational Research Division. “We want to help answer the question, ‘How will climate change affect the frequency of extreme weather?’”
In one example, the scientists began with a run of the Community Atmospheric Model (CAM5), which is the latest in a series of global atmosphere models developed primarily at the National Center for Atmospheric Research. The high-resolution simulation spanned from 1979 to 2005 and is being used to demonstrate how well the model reproduces observed tropical cyclones. It was conducted on Hopper, a Cray XE6 supercomputer at NERSC. The 27-year simulation generated 100 terabytes of data. In comparison, as of September 2011, the Library of Congress has collected about 254 terabytes of data. To detect the hurricanes and cyclones in this simulation, the scientists used code from a model that tracks the intensity of hurricanes and cyclones, and adapted it to run in parallel on large datasets. In this case, the technique churned through the CAM5 simulation in two hours using 7,000 cores at NERSC. It successfully quantified the hurricanes that appear in the simulation. The same process would have taken 583 days on a conventional desktop computer.
Rising Sea Levels Due to Global Warming Are Unstoppable
Because seawater absorbs heat more slowly than the atmosphere above it, our oceans won't feel the full impact of the greenhouse gases already in the air for hundreds of years. Warm water expands, raising sea levels. (Courtesy W. Washington) Select to enlarge.
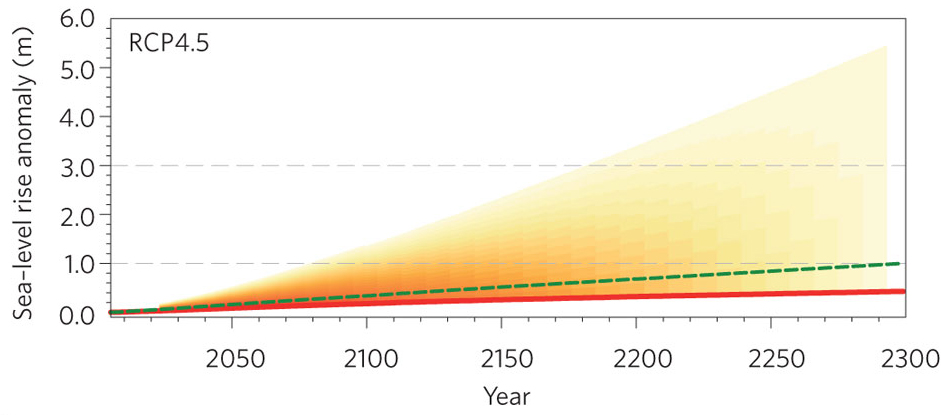
A reduction in greenhouse gas emissions could greatly lessen the impacts of climate change, but the gases already added to the atmosphere ensure a certain amount of sea level rise to come, even if future emissions are reduced. A study using the Community Earth System Model by National Center for Atmospheric Research (NCAR) scientist Gerald Meehl and colleagues quantifies the impact on oceans of the “climate commitment” being made now by human activity using climate models run on NERSC supercomputers
As the atmosphere heats up, the world’s oceans absorb heat more slowly, due to the physical properties of seawater, the oceans' vast depth, and other characteristics. So there is lag time as the heat makes its way deeper and deeper into the oceans. This ever-increasing volume of warm water slowly expands—a process that occurs over centuries. Thermal expansion accounts for about 0.8 millimeters per year of sea level rise since the 1970s, almost half of the estimated total sea level rise per year of 1.8 millimeters (0.075 inch). The other contributions come from melting glaciers and ice sheets, as well as other sources such as piping groundwater to the surface. If the most stringent measures to slow warming were put in place now, thermal expansion alone would still cause substantial sea level rise well into the future, the study finds.
Read More:
http://cs.lbl.gov/news-media/news/2013/rising-sea-levels-due-to-global-warming-are-unstoppable/
About NERSC and Berkeley Lab
The National Energy Research Scientific Computing Center (NERSC) is a U.S. Department of Energy Office of Science User Facility that serves as the primary high performance computing center for scientific research sponsored by the Office of Science. Located at Lawrence Berkeley National Laboratory, NERSC serves almost 10,000 scientists at national laboratories and universities researching a wide range of problems in climate, fusion energy, materials science, physics, chemistry, computational biology, and other disciplines. Berkeley Lab is a DOE national laboratory located in Berkeley, California. It conducts unclassified scientific research and is managed by the University of California for the U.S. Department of Energy. »Learn more about computing sciences at Berkeley Lab.