


Topology, Physics & Machine Learning Take on Climate Research Data Challenges
Big Data Center Projects Explore New Methods for Detecting and Characterizing Extreme Weather Events
September 4, 2018
By Kathy Kincade
Contact: cscomms@lbl.gov
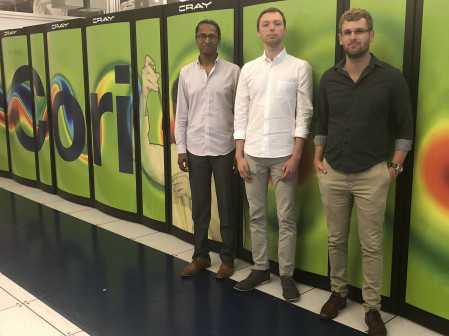
Left to right: Karthik Kashinath, Grzegorz Muszynski and Adam Rupe
Two PhD students who first came to Lawrence Berkeley National Laboratory (Berkeley Lab) as summer interns in 2016 are spending six months a year at the lab through 2020 developing new data analytics tools that could dramatically impact climate research and other large-scale science data projects.
Grzegorz Muszynski is a PhD student at the University of Liverpool, U.K. studying with Vitaliy Kurlin, an expert in topology and computational geometry. Adam Rupe is pursuing his PhD at the University of California at Davis under the supervision of Jim Crutchfield, an expert in dynamical systems, chaos, information theory and statistical mechanics. Both are also currently working in the National Energy Research Scientific Computing Center’s (NERSC) Data & Analytics Services (DAS) group, and their PhDs are being funded by the Big Data Center (BDC), a collaboration between NERSC, Intel and five Intel Parallel Computing Centers launched in 2017 to enable capability data-intensive applications on NERSC’s supercomputing platforms.
During their first summer at the lab, Muszynski and Rupe so impressed their mentors that they were invited to stay on another six months, said Karthik Kashinath, a computer scientist and engineer in the DAS group who leads multiple BDC climate science projects. Their research also fits nicely with the goals of the BDC, which was just getting off the ground when they first came on board. Muszynski and Rupe are now in the first year of their respective three-year BDC-supported projects, splitting time between their PhD studies and their research at the lab.
A Grand Challenge in Climate Science
From the get-go their projects have been focused on addressing a grand challenge in climate science: finding more effective ways to detect and characterize extreme weather events in the global climate system across multiple geographical regions and developing more efficient methods for analyzing the ever-increasing amount of simulated and observational data. Automated pattern recognition is at the heart of both efforts, yet the two researchers are approaching the problem in distinctly different ways: Muszynski is using various combinations of topology, applied math and machine learning to detect, classify and characterize weather and climate patterns, while Rupe has developed a physics-based mathematical model that enables unsupervised discovery of coherent structures characteristic of the spatiotemporal patterns found in the climate system.
“When you are investigating extreme weather and climate events and how they are changing in a warming world, one of the challenges is being able to detect, identify and characterize these events in large data sets,” Kashinath said. “Historically we have not been very good at pulling out these events from very large data sets. There isn’t a systematic way to do it, and there is no consensus on what the right approaches are.”
This is why the DAS group and the BDC are so enthusiastic about the work Muszynski and Rupe are doing. In their time so far at the lab, both students have been extremely productive in terms of research progress, publications, presentations and community outreach, Kashinath noted. Together, their work has resulted in six articles, eight poster presentations and nine conference talks over the last two years, which has fueled interest within the climate science community—and for good reason, he emphasized. In particular, Muszynski’s work was noted as novel and powerful at the Atmospheric Rivers Tracking Method Intercomparison Project (ARTMIP), an international community of researchers investigating Atmospheric Rivers.
“The volume at which climate data is being produced today is just insane,” he said. “It’s been going up at an exponential pace ever since climate models came out, and these models have only gotten more complex and more sophisticated with much higher resolution in space and time. So there is a strong need to automate the process of discovering structures in data.”
There is also a desire to find climate data analysis methods that are reliable across different models, climates and variables. “We need automatic techniques that can mine through large amounts of data and that works in a unified manner so it can be deployed across different data sets from different research groups,” Kashinath said.
Using Geometry to Reveal Topology
Muszynski and Rupe are both making steady progress toward meeting these challenges. Over his two years at the lab so far, Muszynski has developed a framework of tools from applied topology and machine learning that are complementary to existing tools and methods used by climate scientists and can be mixed and matched depending on the problem to be solved. As part of this work, Kashinath noted, Muszynski parallelized his codebase on several nodes on NERSC’s Cori supercomputer to accelerate the machine learning training process, which often requires hundreds to thousands of examples to train a model that can classify events accurately.
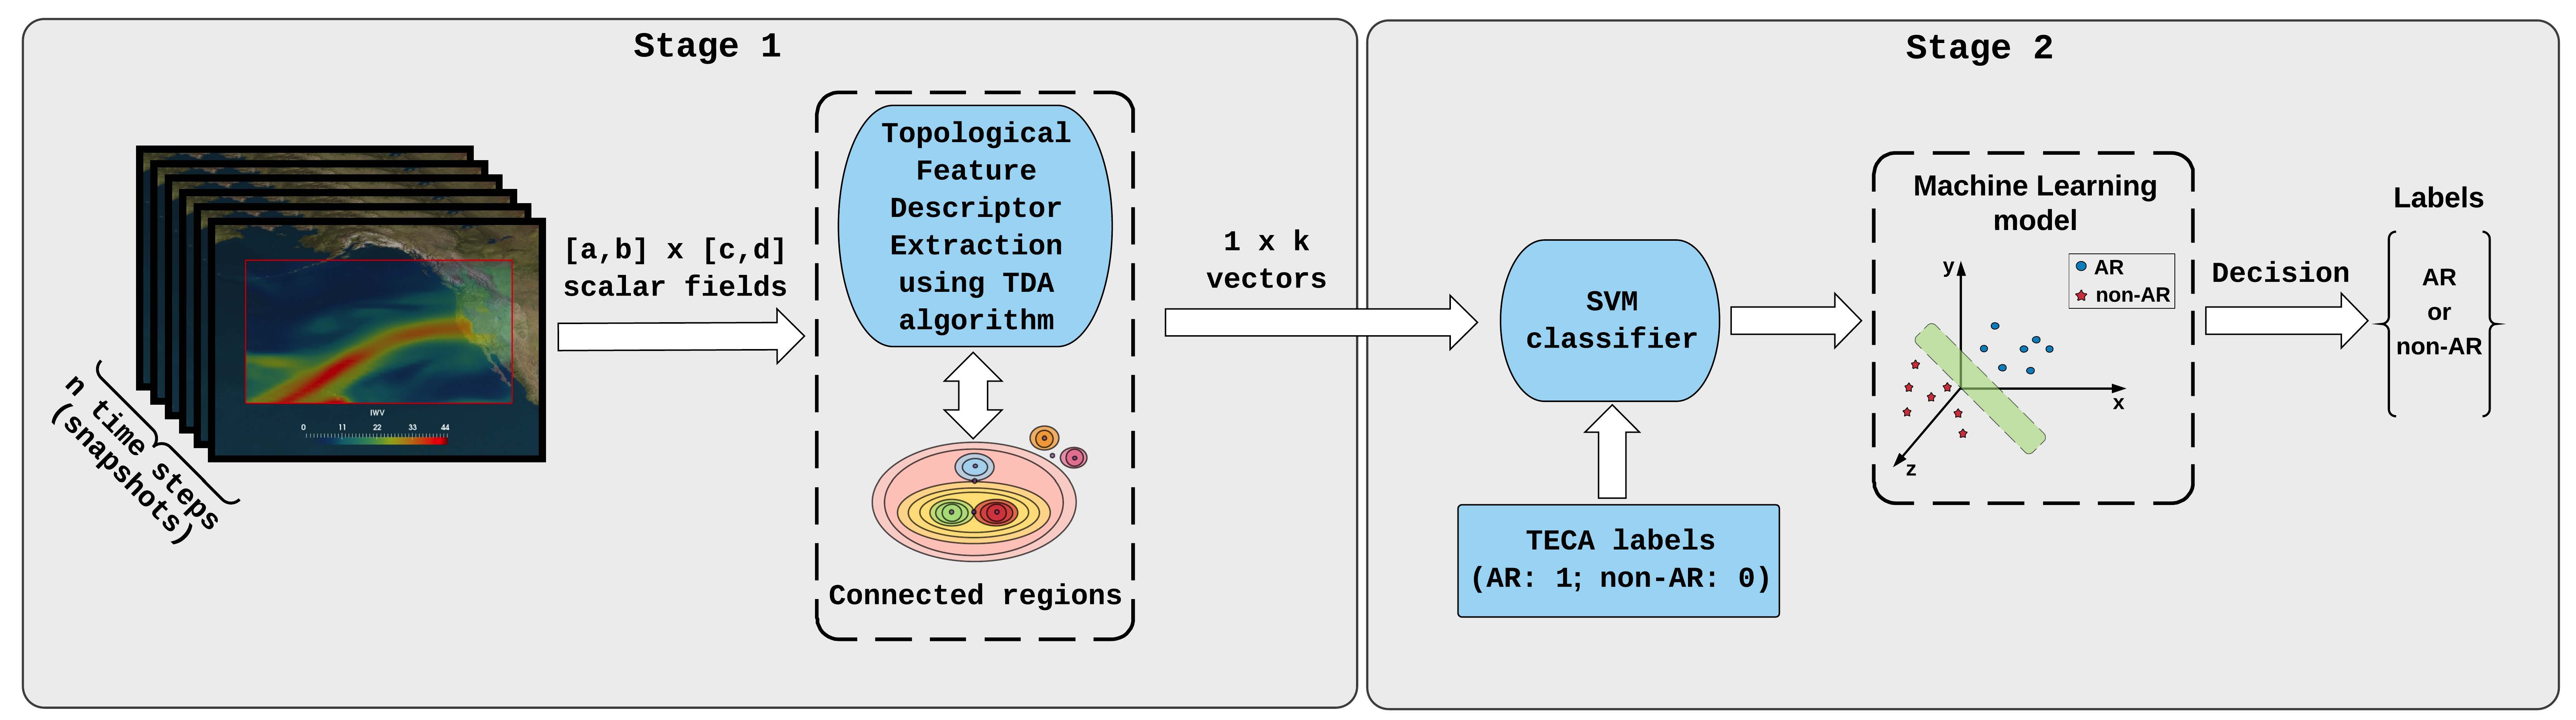
Block diagram of the atmospheric river pattern recognition method.
His topological methods also benefited from the guidance of Dmitriy Morozov, a computational topologist and geometer at CRD. In a paper submitted earlier this year to the journal Geoscientific Model Development, Muszynski and his co-authors used topological data analysis and machine learning to recognize atmospheric rivers in climate data, demonstrating that this automated method is “reliable, robust and performs well” when tested on a range of spatial and temporal resolutions of CAM5.1 climate model output. They also tested the method on MERRA-2, a climate reanalysis product that incorporates observational data that makes pattern detection even more difficult. In addition, they noted, the method is “threshold-free”, a key advantage over existing data analysis methods used in climate research.
“Most existing methods use empirical approaches where they set arbitrary thresholds on different physical variables, such as temperature and wind speed,” Kashinath explained. “But these thresholds are highly dependent on the climate we are living in right now and cannot be applied to different climate scenarios. Furthermore, these thresholds often depend on the type of dataset and spatial resolution. With Grzegorz’s method, because it is looking for underlying shapes (geometry and topology) of these events in the data, they are inherently free of the threshold problem and can be seamlessly applied across different datasets and climate scenarios. We can also study how these shapes are changing over time that will be very useful to understand how these events are changing with global warming.”
While topology has been applied to simpler, smaller scientific problems, this is one of the first attempts to apply topological data analysis to large climate data sets. “We are using topological data analysis to reveal topological properties of structures in the data and machine learning to classify these different structures in large climate datasets,” Muszynski said.
The results so far have been impressive, with notable reductions in computational costs and data extraction times. “I only need a few minutes to extract topological features and classify events using a machine learningclassifier, compared to days or weeks needed to train a deep learning model for the same task,” he said. “This method is orders of magnitude faster than traditional methods or deep learning. If you were using vanilla deep learning on this problem, it would take 100 times the computational time.”
Another key advantage of Muszynski’s framework is that “it doesn’t really care where you are on the globe,” Kashinath said. “You can apply it to atmospheric rivers in North America, South America, Europe – it is universal and can be applied across different domains, models and resolutions. And this idea of going after the underlying shapes of events in large datasets with a method that could be used for various classes of climate and weather phenomena and being able to work across multiple datasets—that becomes a very powerful tool.”
Unsupervised Discovery Sans Machine Learning
Rupe’s approach also involves thinking outside the box by using physics rather than machine or deep learning to analyse data from complex nonlinear dynamical systems. He is using physical principles associated with organized coherent structures—events that are coherent in space and persist in time—to find these structures in the data.
“My work is on theories of pattern and structure in spatiotemporal systems, looking at the behavior of the system directly, seeing the patterns and structures in space and time and developing theories of those patterns and structures based directly on that space-time behavior,” Rupe explained.
In particular, his model uses computational mechanics to look for local causal states that deviate from a symmetrical background state. Any structure with this symmetry-breaking behavior would be an example of a coherent structure. The local causal states provide a principled mathematical description of coherent structures and a constructive method for identifying them directly from data.
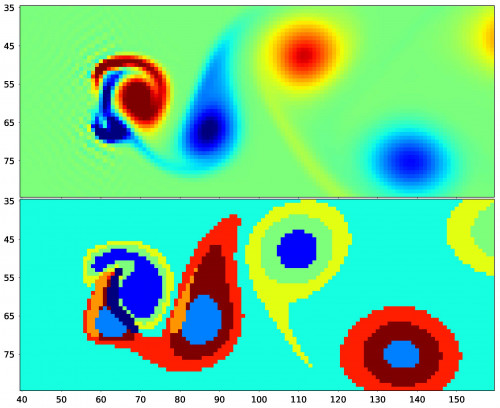
The top image is the vorticity field for flow around a linear barrier using the Lattice Boltzmann algorithm. The bottom image is the associated local causal states. Each color (assigned arbitrarily) corresponds to a unique local causal state. Image: Adam Rupe
“Any organized coherent structure in a spatiotemporal dataset has certain properties—geometrical, thermodynamical, dynamical and so on,” Kashinath said. “One of the ways to identify these structures is from the geometrical angle—what is its shape, how does it move and deform, how does its shape evolve over time, etc. That is the approach Grzegorz is taking. Adam’s work, which is deeply rooted in physics, is also focused on discovering coherent patterns from data but is entirely governed by the physical principles.”
Rupe’s approach requires novel and unprecedented scaling and optimization on Cori for multiple steps in the unsupervised discovery pipeline, including clustering in very high-dimensional spaces and clever ways of data reuse and feature extraction, Kashinath noted.
Rupe has not yet applied his model to large, complex climate data sets but he expects to do so on NERSC’s Cori system in the next few months. His early computations focused on cellular automata data (idealized discrete dynamical systems with one space dimension and one time dimension); he then moved on to more complex real-valued models with one space dimension and one time dimension and is now working with low-resolution fluid flow simulations that have two space dimensions and one time dimension. He will soon move on to more complex, 3-dimensional, high-resolution fluid flow simulations—a precursor to working with climate data.
“We started with these very simple cellular automata models because there is a huge body of theory with these models. So initially we weren’t using our technique to study the models, we were using those models to study our technique and see what it is actually capable of doing,” Rupe said.
Among other things, they have discovered that this approach offers a powerful alternative to machine and deep learning by enabling unsupervised segmentation and pixel-level identification of coherent structures without the need for labeled training data.
“As far as we are aware, this is the only completely unsupervised method that does not require training data,” Rupe said. “In addition, it covers every potential structure and pattern you might be looking for in climate data, and you don’t need preconceived notions of what you are looking for. The physics helps you discover all of that automatically.”
It offers other advantages over machine and deep learning for finding coherent structures in scientific data sets, Kashinath added, including that it is physics-based and hence on very firm theoretical footing.
“This method is complementary to machine and deep learning in that it is going after the same goal of discovering complex patterns in the data, but it is specifically well suited to scientific data sets in a way that deep learning might not be,” he said. “It is also potentially much more powerful than some of the existing machine learning techniques because it is completely unsupervised.”
Muszynski and Rupe are good examples of success stories from the Computing Sciences and NERSC summer internship program and of climate informatics projects at the BDC and NERSC. As early pioneers in developing novel analytics for large climate datasets, they are already leading the way in a new wave of advanced data analytics.
NERSC is a U.S. Department of Energy User Facility.
About NERSC and Berkeley Lab
The National Energy Research Scientific Computing Center (NERSC) is a U.S. Department of Energy Office of Science User Facility that serves as the primary high performance computing center for scientific research sponsored by the Office of Science. Located at Lawrence Berkeley National Laboratory, NERSC serves almost 10,000 scientists at national laboratories and universities researching a wide range of problems in climate, fusion energy, materials science, physics, chemistry, computational biology, and other disciplines. Berkeley Lab is a DOE national laboratory located in Berkeley, California. It conducts unclassified scientific research and is managed by the University of California for the U.S. Department of Energy. »Learn more about computing sciences at Berkeley Lab.